Hello and welcome to the Weekly Market Metrics!
I am Sandeep Rao, and we’re in Week 51 of the year—just one more week to go in 2025!

You know, every year in December, people discuss a phenomenon known as the Santa Rally or Christmas Rally in the stock market indexes. What that means is that the last week of the year has a higher odds of a positive move. Now, I am not sure if it will happen again this year.
But me being me, I looked up some data for the past 10 years. What I tested for is: we go long on the 5th last trading day of December, and exit on the 2nd trading day of Jan.
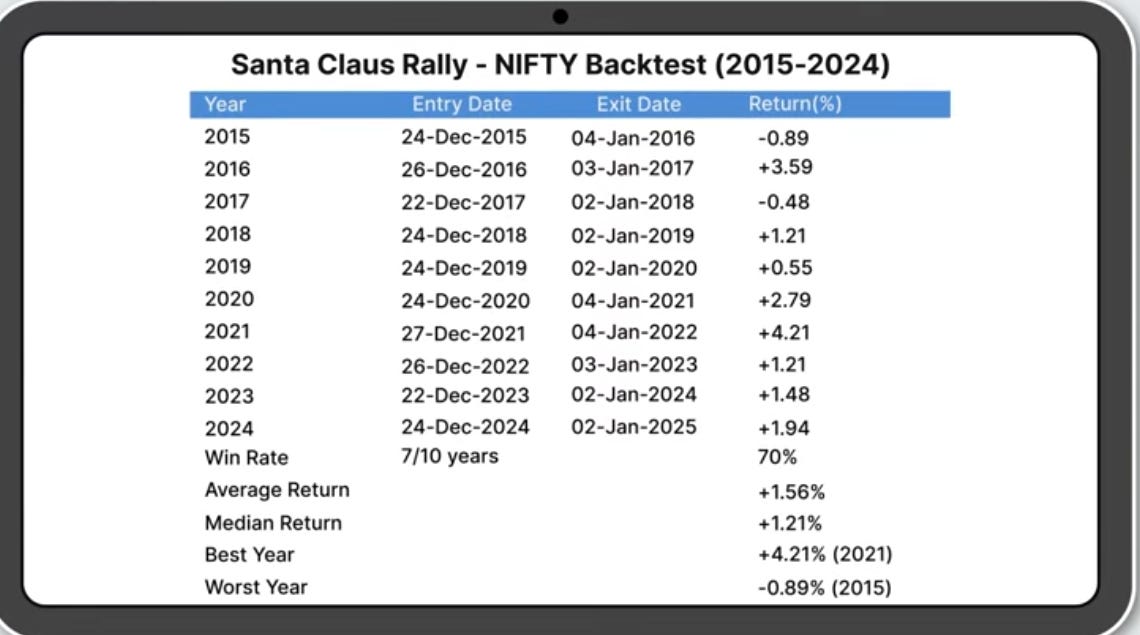
Here’s what the data tells us: There is a 70% chance of the month closing in positive. Median returns are at 1.21%.
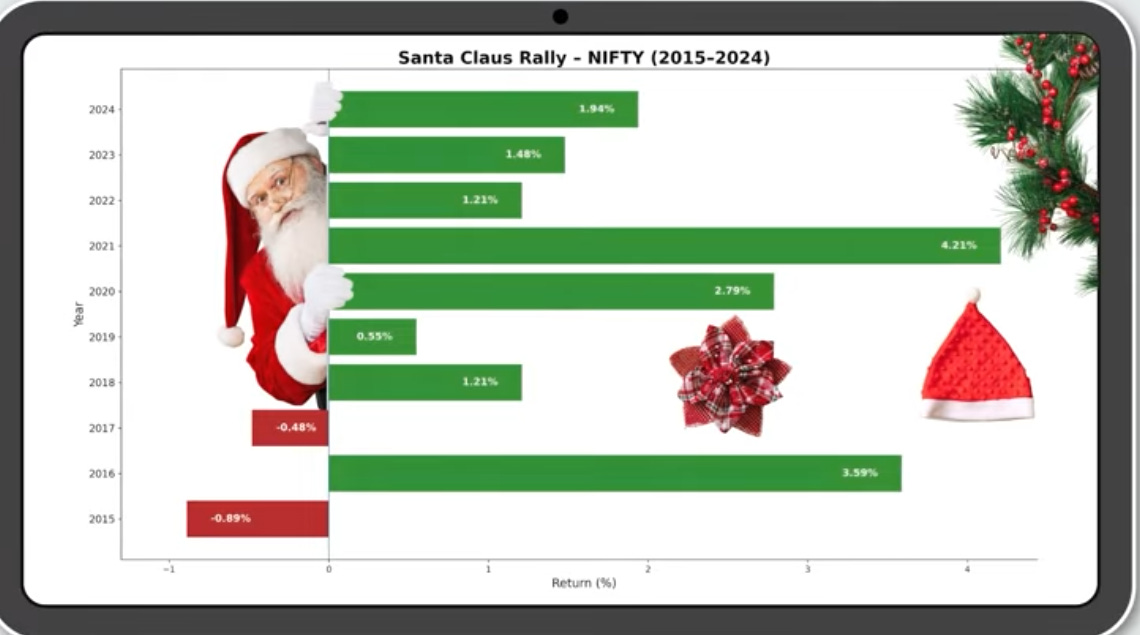
All past 7 years have been positive. For the current year, the 5th day from the end of the year will be 26th Dec, Friday, and the exit date will be on the 2nd of Jan. Let’s see how it plays out.
But in reality, this end-of-month positive drift is not something specific to December—it works for most months, across the world. It’s called the TOTM (Turn of the Month) anomaly. Maybe I will do a video on it sometime.
Talking about the week, markets continued to test our patience and also at times scared us a fair bit by making a low of close to 25,700 only to bounce back in the last session, a bit similar to last week. This week again we are at the same spot—we saw a down move in the first four days with some recovery in the last session, so what to expect now?
Let’s check the charts and see how the price action played out and what looks possible for the coming week.
As always, Nifty first.
NIFTY 50 - Technical Analysis
Weekly Timeframe
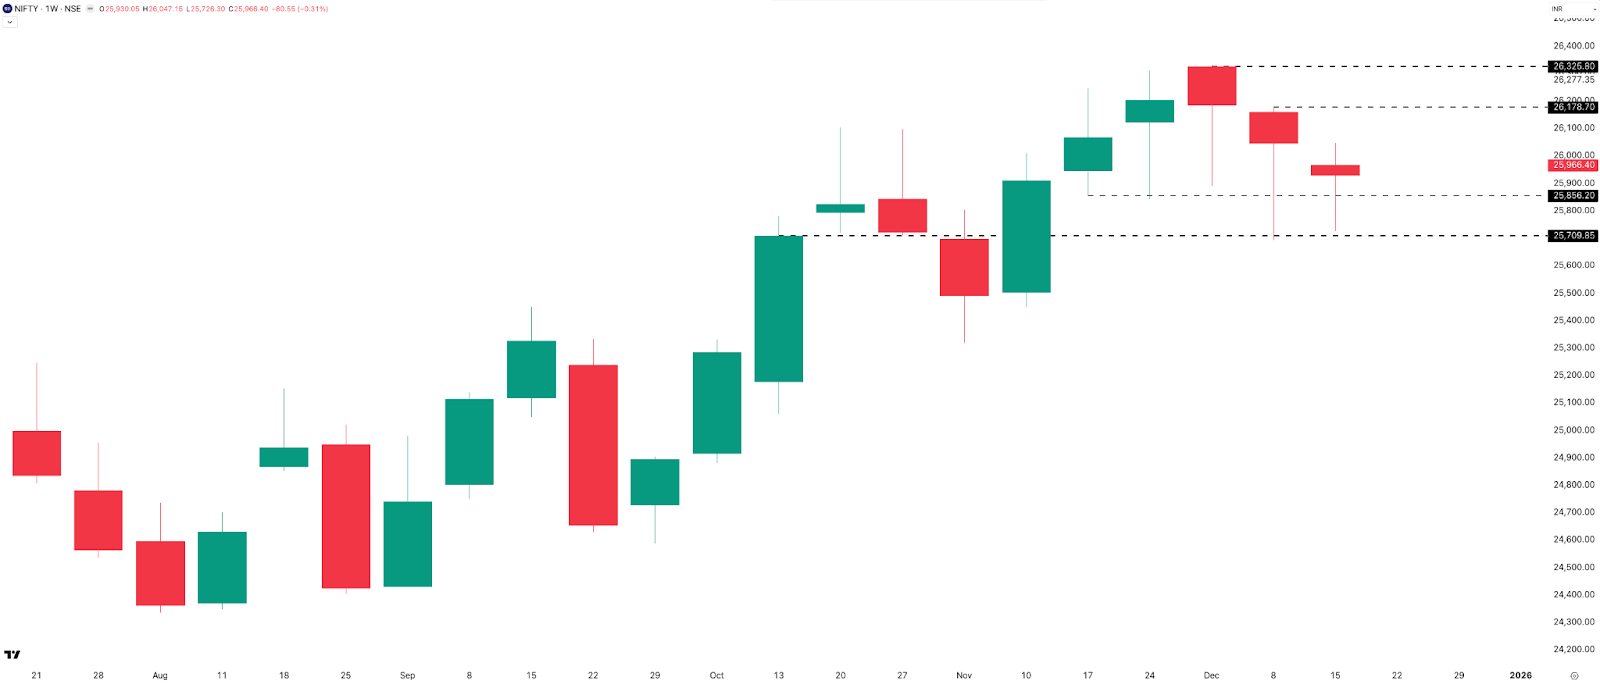
After three strong green weekly candles, NIFTY has now printed three consecutive red candles. The latest week formed a bearish inside candle, with the entire range contained within the previous week’s candle, signaling consolidation and indecision.
NIFTY slipped about 80 points or 0.31%, closing near 25,966—just below the 26,000 level. The weekly range narrowed sharply to 320 points (1.23%), down from last week’s 485 points.
Support continues to hold at the 25,850–25,700 zone, a level NIFTY has defended for the past two weeks. On the upside, immediate resistance lies at 26,200, followed by the all-time high near 26,325.
As long as NIFTY remains between 25,700 and 26,200, the structure stays range-bound. Bias remains sideways, with a breakout only on a decisive weekly close above 26,200, or weakness below 25,700.
Daily Timeframe
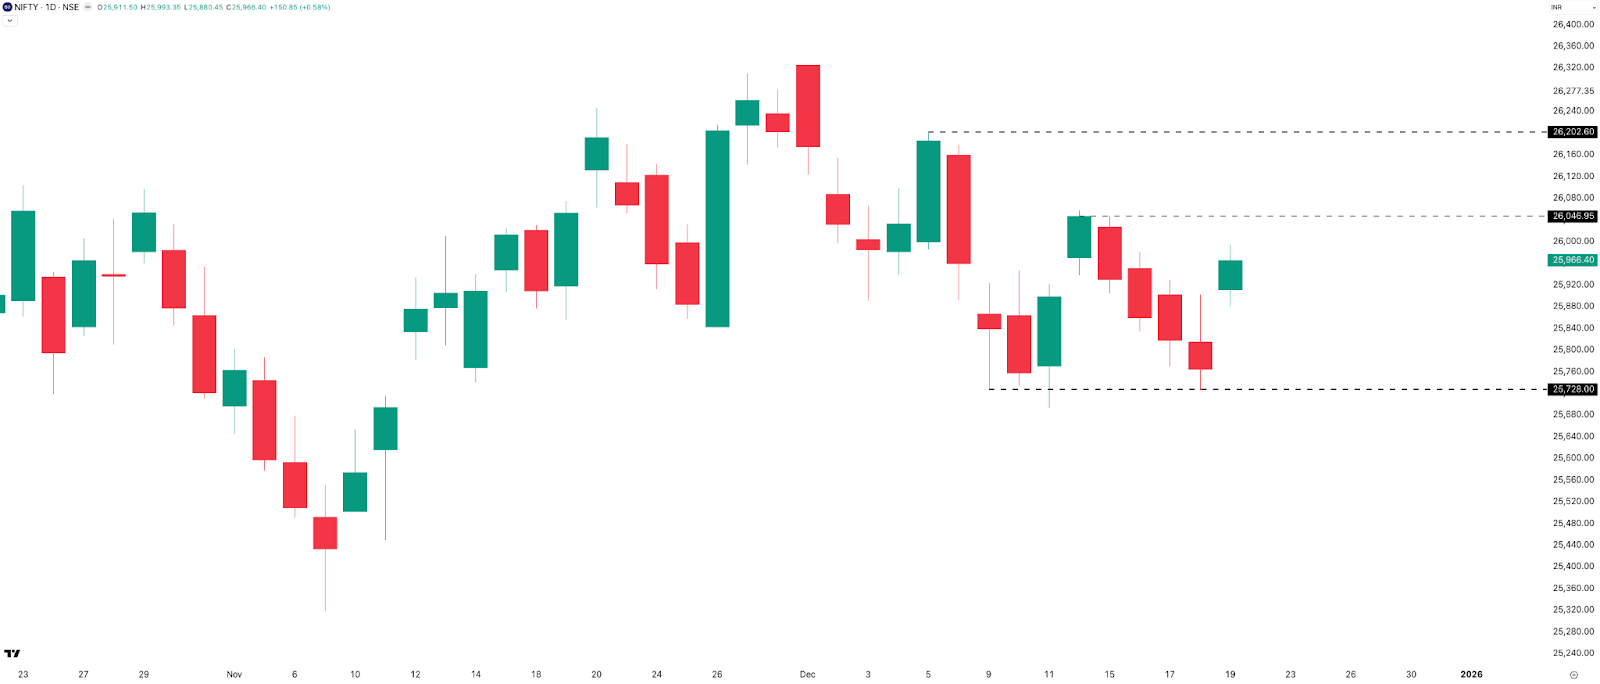
On the daily timeframe, the same consolidation pattern continues, with NIFTY showing weakness in the early part of the week, followed by a mild recovery towards the end. This week, NIFTY printed four consecutive red candles, extending the pattern we’ve been seeing over the past two weeks, with Friday finally closing in the green.
Once again, buying emerged near the 25,700 level, where NIFTY managed to stabilize and bounce. Despite the bounce, there is still no clear bullish strength visible on the daily chart.
NIFTY continues to remain stuck in a broad 500-point range between 25,700 and 26,200, with 26,000 and 26,100 acting as immediate resistance zones. As discussed last week, this move continues to look like a month-long consolidation rather than a fresh uptrend.
Until NIFTY manages a strong daily close above the 26,150–26,200 zone, the broader bias remains sideways. For now, 25,700 remains the key support to watch, while 26,200 continues to cap the upside, keeping the index range-bound in the near term.
Hourly Timeframe
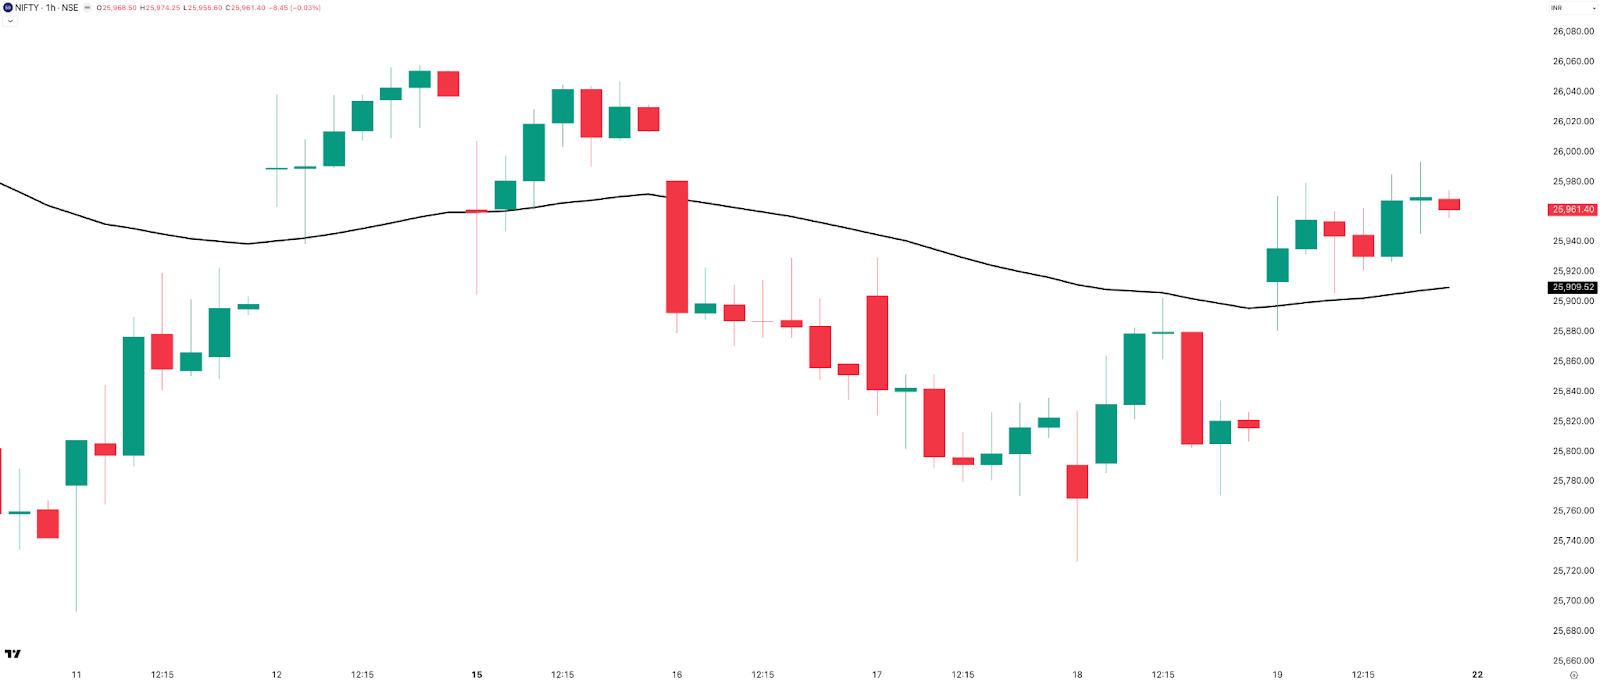
On the 1-hour chart, NIFTY briefly stayed above the 50 EMA on Monday, but from Tuesday through Thursday it traded consistently below the 50 EMA, before trying to move back above it on Friday. This back-and-forth around the 50 EMA clearly shows the absence of any clean short-term trend.
This is exactly why trend following has been extremely difficult in NIFTY over the past few weeks. Even though December is historically an uptrending month, this December has turned out to be very tough, especially for directional traders.
In such an environment, positional non-directional sellers are the ones benefiting, while trend followers continue to get whipsawed with limited follow-through on either side.
At the moment, NIFTY is above the 50 EMA by just 50 points on the hourly chart, and unless we see sustained price action above it, the market is likely to remain choppy. Overall, based on the 1-hour timeframe, the bias remains sideways, with no clear edge for trend-based trades.
NIFTY Range Till Expiry
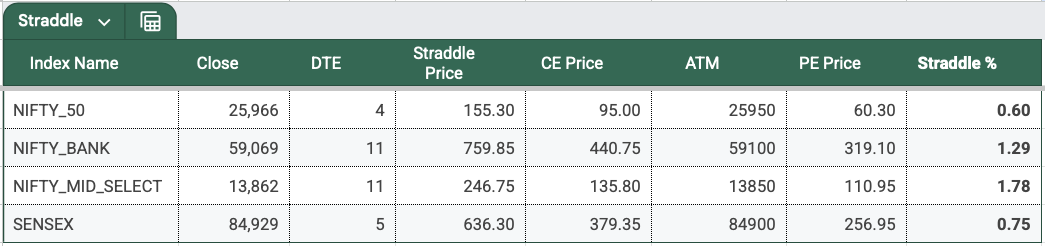
Talking about NIFTY’s expected range till expiry on Tuesday, 23rd December, if we look at the options data, the ATM straddle closed around 155 points, which is broadly in line with last week.
With NIFTY spot closing near 25,966, this gives us an expected expiry range of:
- Upside: 25,966 + 155 = 26,121
- Downside: 25,966 − 155 = 25,811
So effectively, the market is pricing in a roughly 300-point range, with 26,100 on the upside and 25,800 on the downside as the key levels to watch into expiry.
Open Interest Analysis
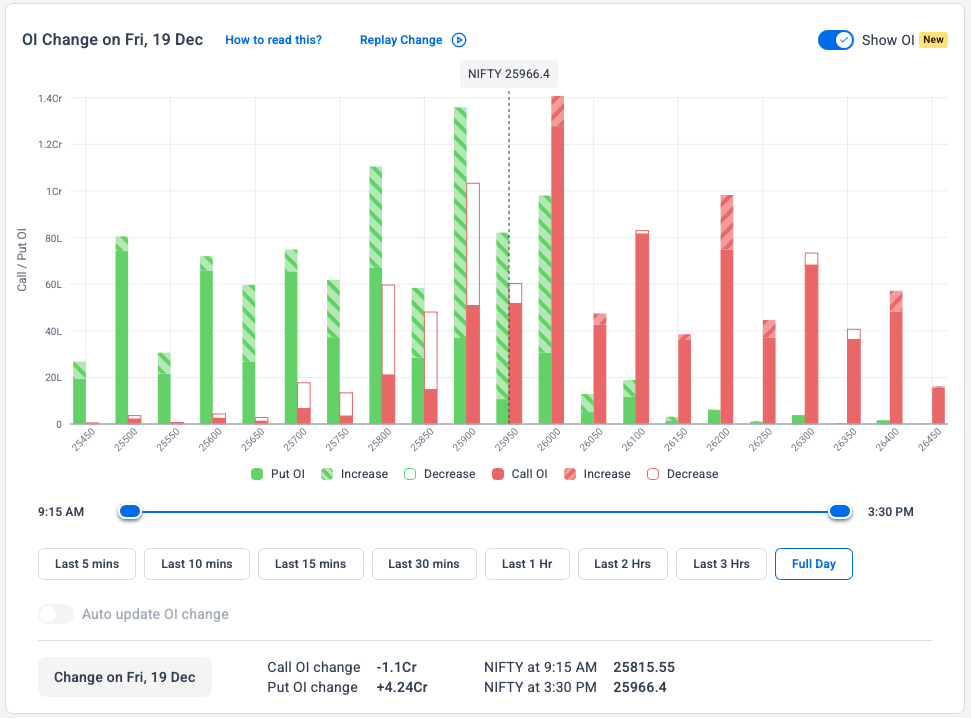
Looking at the Open Interest data, 26,000 CE and 25,900 PE currently hold the highest open contracts. This suggests that 26,000 is emerging as a strong resistance zone.
When we combine this with our weekly and daily chart analysis, where 26,000, 26,100, and 26,200 have already been identified as resistance levels, it becomes clear that the upside for NIFTY is likely to face multiple hurdles.
So even if NIFTY attempts a move higher, the journey upward may not be smooth, as selling pressure is likely to emerge at multiple levels. For now, this further reinforces the view of a sideways, range-bound market, especially as we approach expiry.
SENSEX - Technical Analysis
Weekly Timeframe
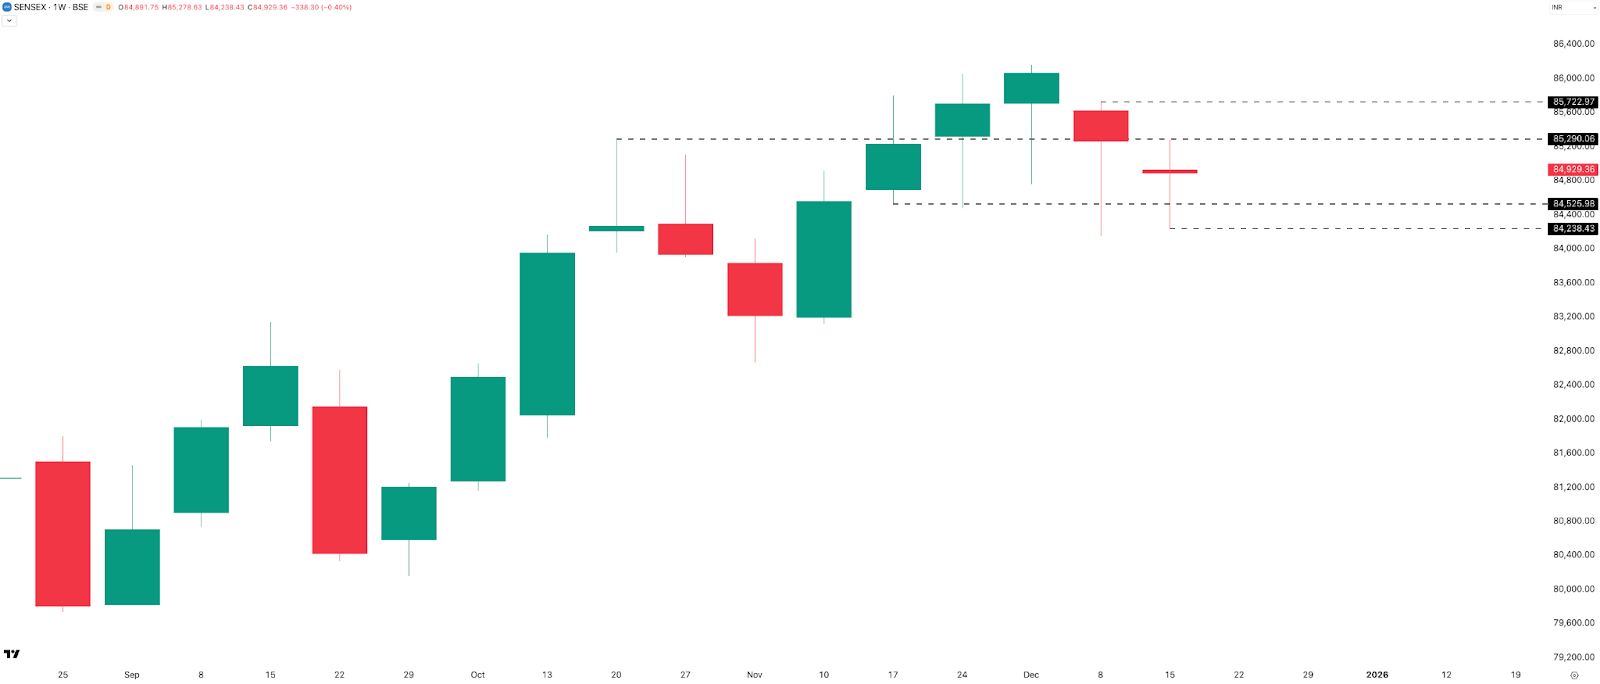
On the weekly timeframe, SENSEX also made a bearish inside candle. It closed 338 points or 0.4% lower, settling near 84,930. This marks the second consecutive red week, coming after a strong run of four green weekly candles.
The weekly range narrowed to about 1,040 points, or 1.22%, compared to last week’s much wider 1,500+ point range, indicating ongoing consolidation.
On the downside, supports are at 84,500 and then near 84,200. On the upside, resistance is seen at 85,300, followed by 85,700. For now, SENSEX appears to be consolidating within a broad range, with no clear directional edge on the weekly chart.
Daily Timeframe
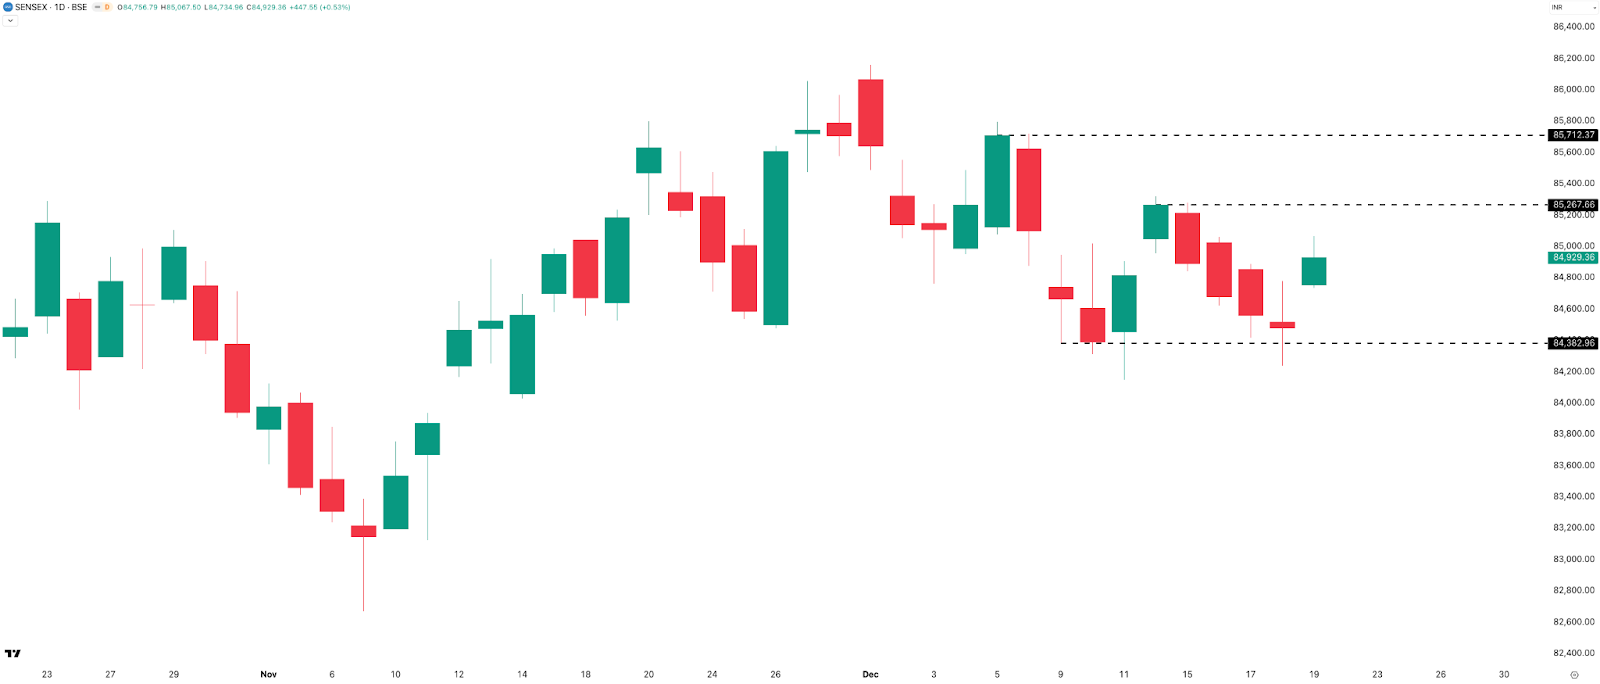
On the daily timeframe, SENSEX mirrors the NIFTY structure: four consecutive red candles followed by a green candle on Friday. SENSEX is currently range-bound, with 84,400 acting as key support and 85,300 as immediate resistance on the daily chart. A higher resistance zone is placed near 85,700.
Overall, the bias for SENSEX remains sideways until a decisive breakout or breakdown from this range.
SENSEX Expected Range Till Expiry

The SENSEX ATM straddle closed at 636 points, down from 719 points last week. Based on this:
- Upside: 85,565 (84,929 + 636)
- Downside: 84,293 (84,929 − 636)
This implies an expected move of approximately ±0.75% or ~600 points on either side.
Note: SENSEX expiry is on Wednesday next week due to the trading holiday on Thursday. This makes the current SENSEX ATM Straddle a 3 DTE at closing premium.
BANK NIFTY - Technical Analysis
Daily Timeframe
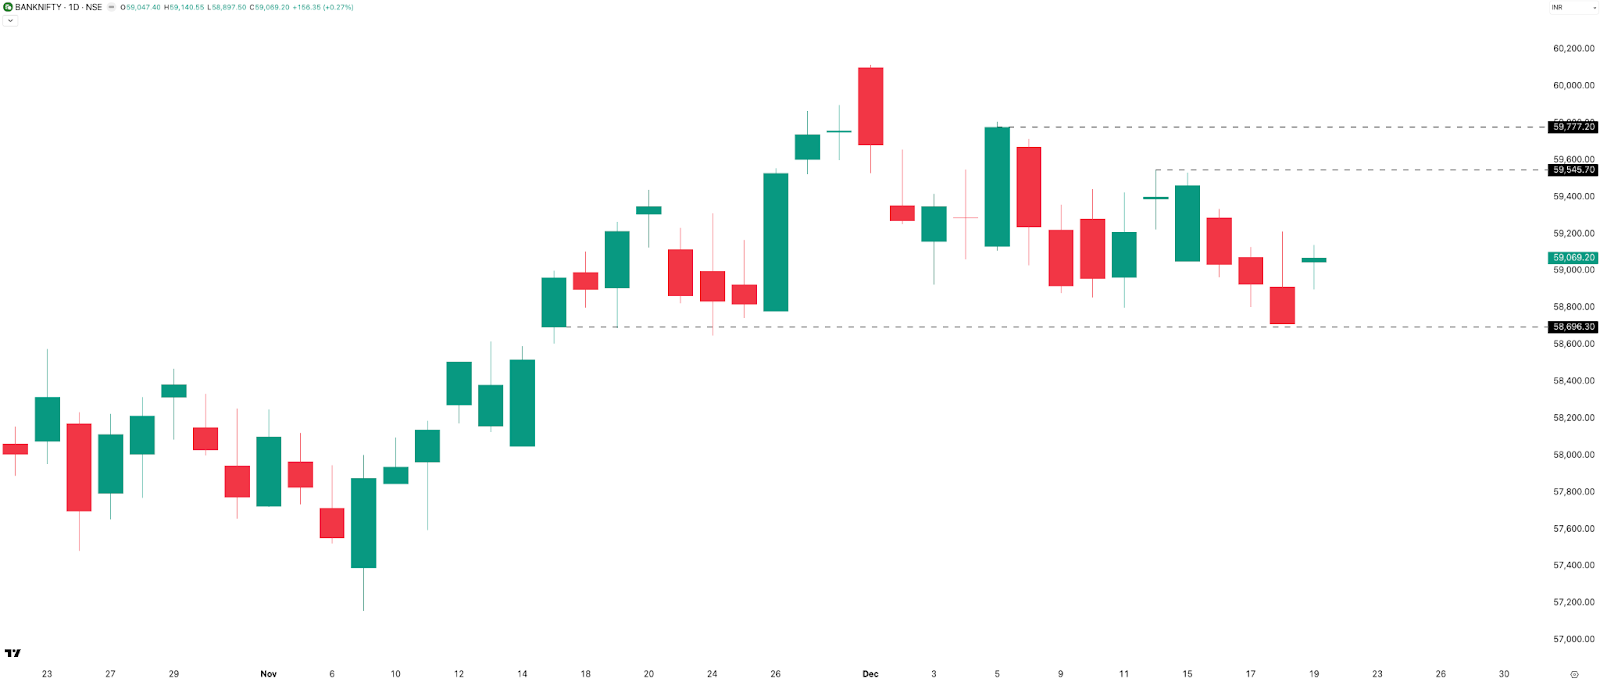
On the daily timeframe, BANKNIFTY closed green on Monday, followed by three consecutive red candles. Friday’s candle was indecisive, closely resembling last Friday’s candle. It closed at 59,069.
For the week, BANKNIFTY lost 321 points (0.54%). It formed a weekly range of 820 points (1.38%), slightly lower than last week’s 913-point range.
BANKNIFTY bounced from the 58,700 level, which has continued to act as a strong support zone over the past several weeks. Resistance remains intact near the 59,550 zone.
Overall, the trend remains sideways, with BANKNIFTY trapped between 59,550 and 58,700, a range of approximately 850 points.
Hourly Timeframe
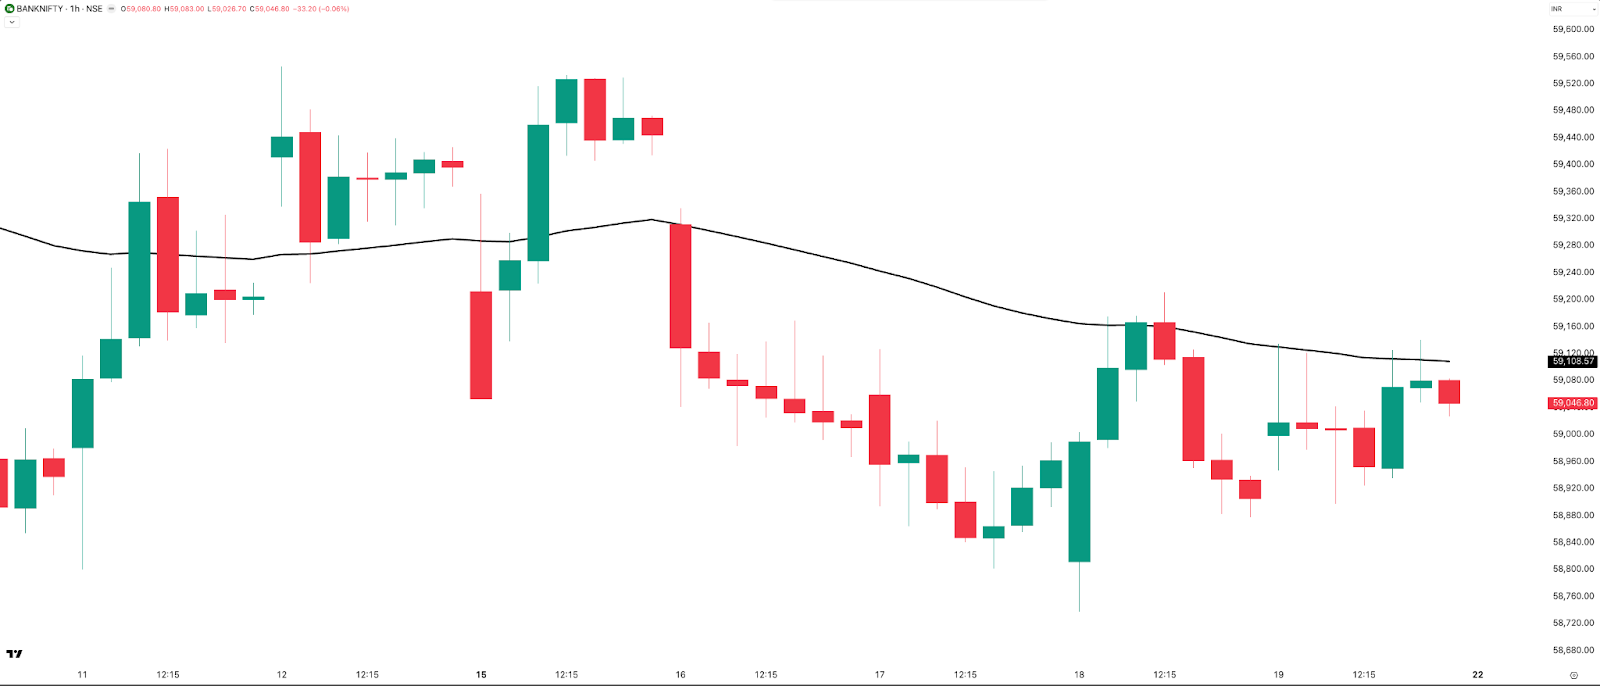
On the 1-hour chart with the 50 EMA, BANKNIFTY remained choppy on Monday and then spent most of the week trading below the 50 EMA, with multiple pullbacks that faced rejection near the EMA.
This price action suggests a sideways and choppy market, with no clear short-term trend in place. Short-term trend-following setups continue to struggle in this environment.
Market Metrics Summary
Rate of Change (Weekly Performance)
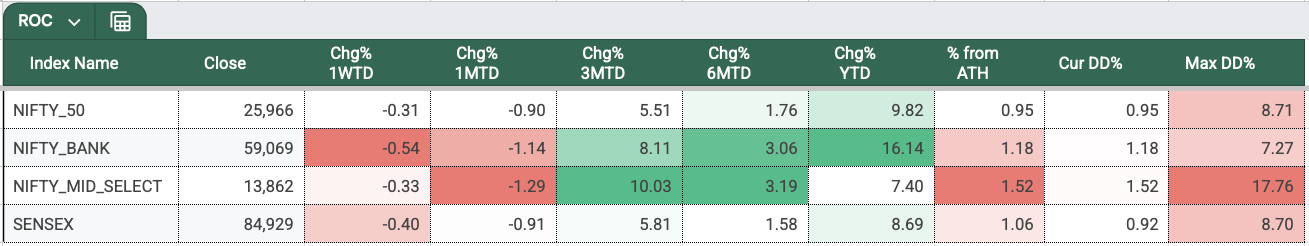
Another flat to negative week across indices, with WTD returns around –0.5%. This can clearly be classified as a consolidation week.
With just one and a half weeks left in 2025 and all major indices trading within 1–1.5% of their all-time highs, the one-plus month of consolidation is getting too frustrating. High time we get some direction and a steady trend.
Sectoral Performance
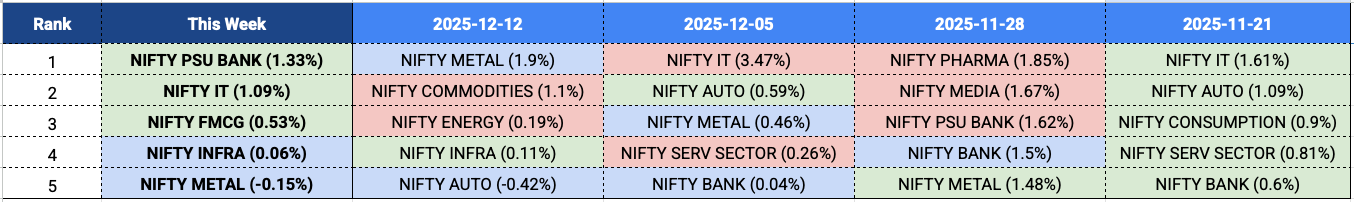
PSU Bank tops the list after a two-week break, followed by IT (maybe because of the weak rupee—it’s back in the top 5 after a week’s pause). Next, we have FMCG show up in the list after a good 9 weeks. My observation is that FMCG shows up only when the market seeks defensive sectors—perhaps it was one of those weeks. Then we have Nifty Infra and Metal, which continue from the past week.
That’s about it for the sectors.
Volatility & Derivatives
Range & Expiries
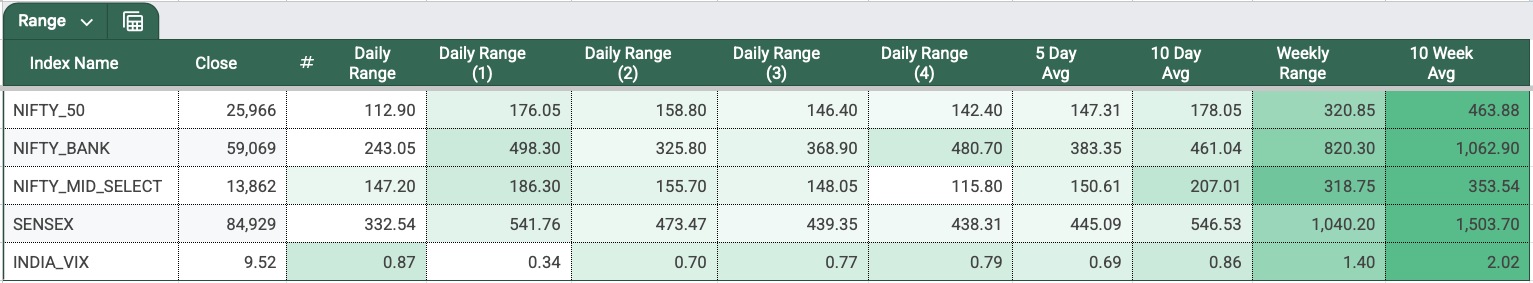
This week again, Friday continues to be the lowest daily range day for all four indices. Thursday was the highest range day for all four indices. NIFTY’s 5-day average range shrank to 147 from 208 last week, confirming a consolidation week, and the 10-day average range also shrank from 195 to 178.
Now, let’s talk about the NIFTY expiry—this week’s NIFTY expiry saw a range of 146 points, while the opening ATM straddle premium was 108 points. The index saw 167 points or 0.4% downmove on that day.
Overall, it was a relatively easy expiry, especially for far OTM option sellers. I’d rate this expiry 3/10 for sellers, where 1 is easy, and 10 is hard.
SENSEX expiry on Thursday was far from easy. The index dropped 330 points in the first 30 minutes, then rallied 541 points till 1 PM, and later sold off 409 points to finally close 78 points lower than the previous day. The day produced a 542-point range against an ATM straddle premium of 316 points at open. I’d rate this expiry 6/10 on the easy-to-hard scale.
India VIX
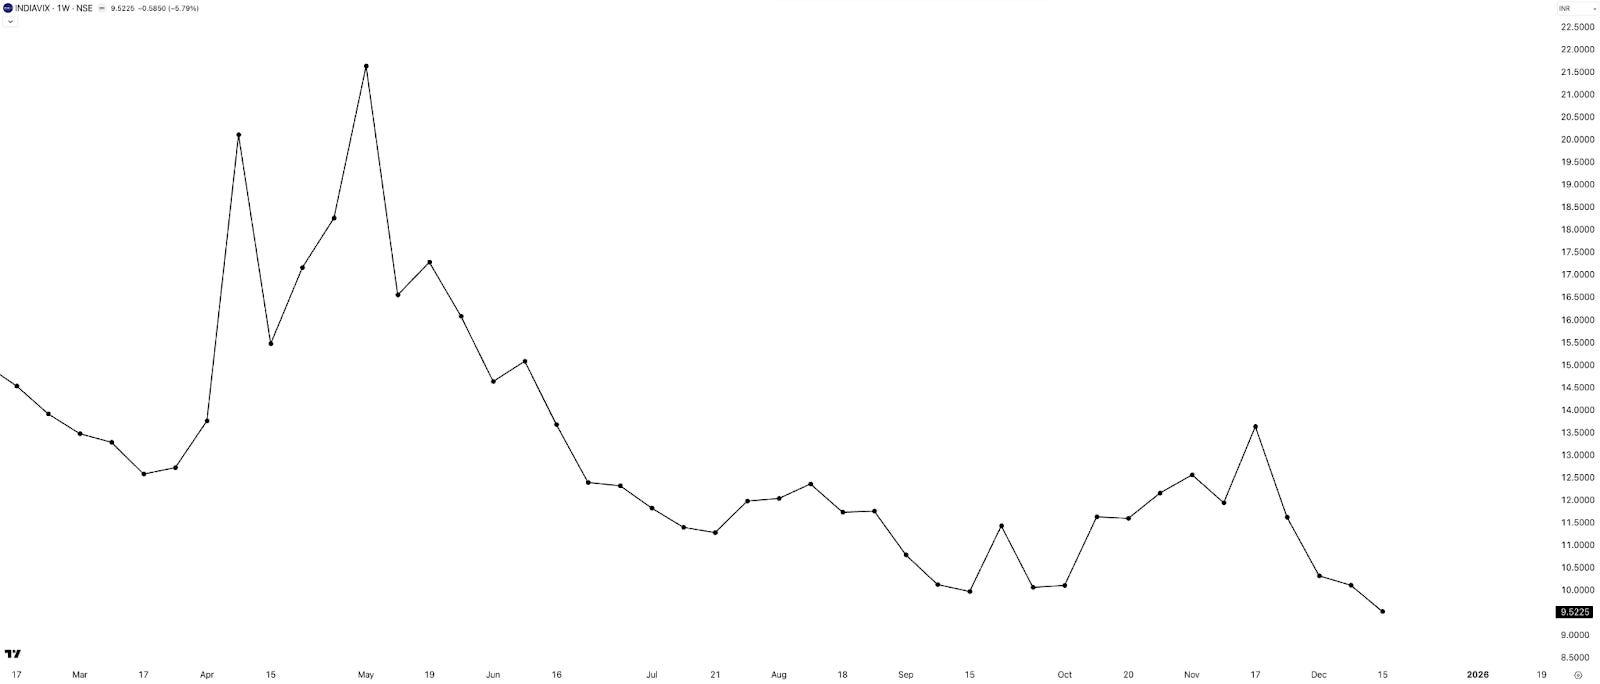
INDIAVIX fell 5.8% this week, closing below 10. Such low VIX levels indicate compressed option premiums, making the risk–reward unfavorable for option sellers. Like any price, VIX is mean-reverting, so from these levels, the probability of VIX rising in the coming weeks is higher than it falling further. Let’s see how it plays out.
Commodities Update
(Data: MCX Continuous Futures - Back Adjusted)
The price action in the commodity pack this week is very similar to last week in terms of general direction, only a little muted.
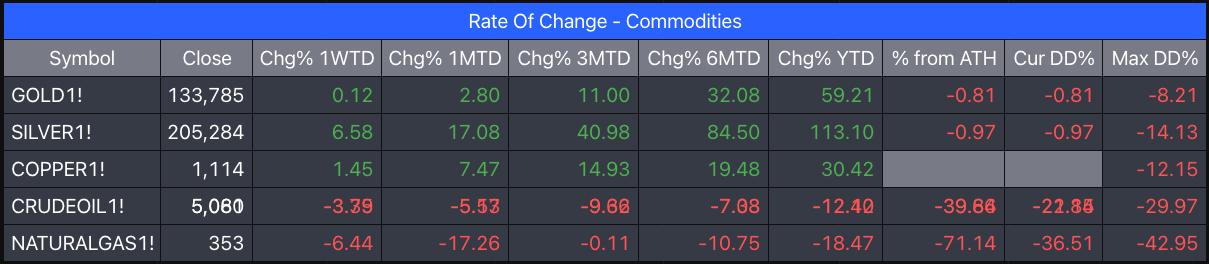
Silver continued to lead, up 6.5% and about 113% YTD. Then we had copper, which was up 1.5%, and then gold at 0.1%. Crude was down 3.4% and natural gas was down about 6.5%, in total about 17% down for the month. In hindsight, one could have gone long on silver and short on natgas and could have retired. Okay, I am just kidding.
That’s pretty much in the commodities this week.
Summary & What Caught My Attention
The markets again consolidated this week, and the last trading day raised our hopes again. On commodities, it was a good week for Silver if you were long and Natural Gas if you were short.
It’s been generally a 6-7ish week for option sellers. Yes, I just learnt that slang from some of my Gen Z colleagues. Okay, in all seriousness, hoping for better price action in the coming weeks. Let’s see.
What Caught My Attention This Week
One: I read this memo from Howard Marks on the AI Bubble—well-structured thought process, as one would expect from him. He concludes that while AI is likely a unique, “genie out of the bottle” technology that may replace human cognition, current market behavior is undeniably speculative. With almost everyone calling out the bubble, it’s really getting interesting.
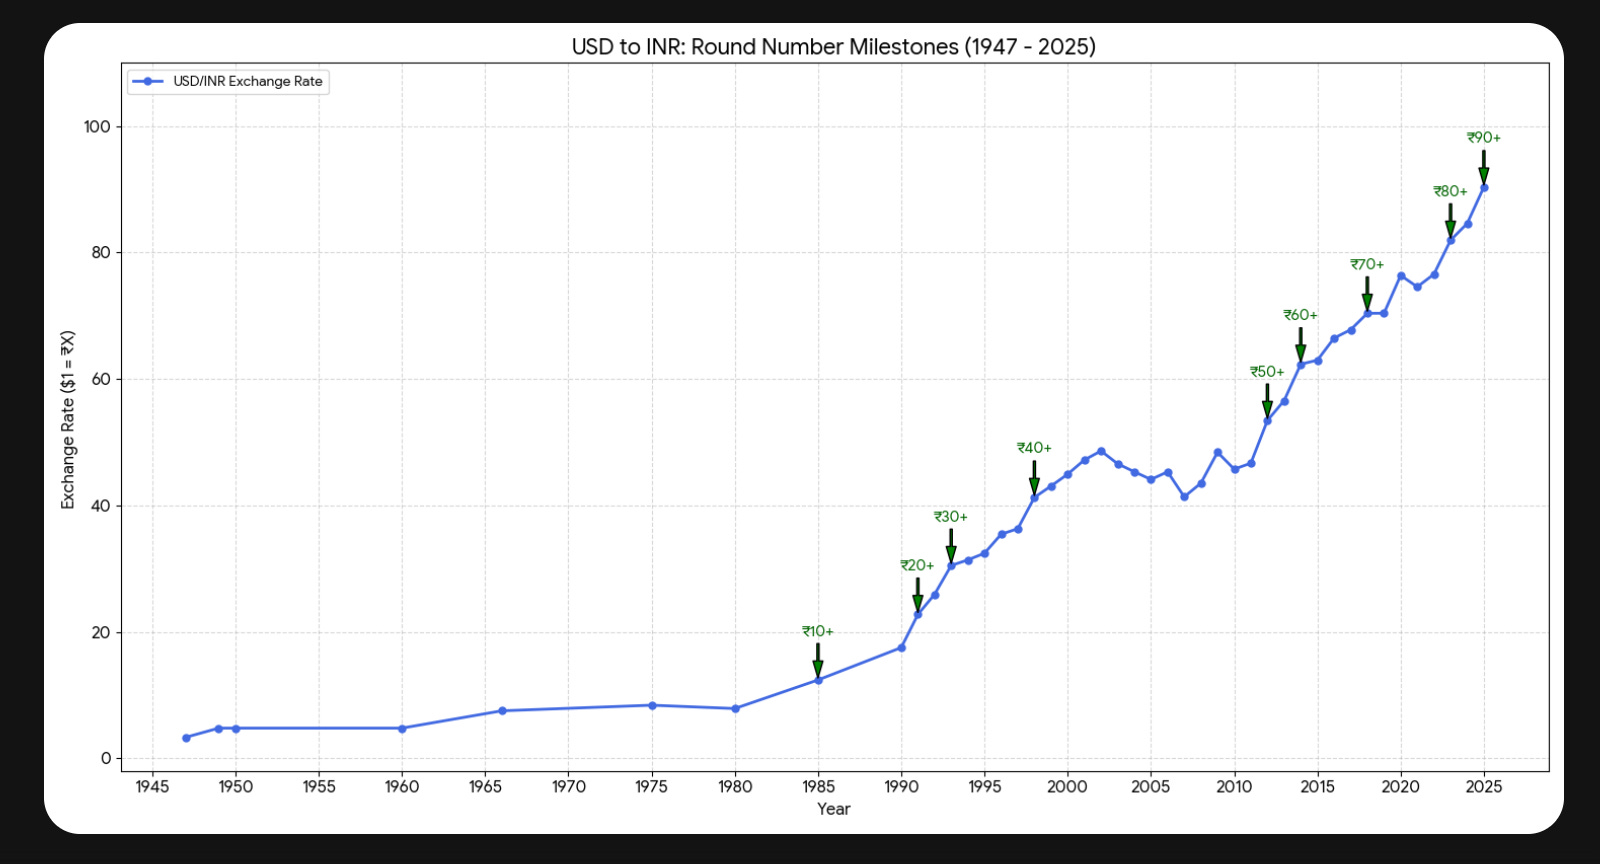
Two: I came across this USD-INR exchange rate data from 1947, and I thought about plotting it to see what it looks like. As evident since independence—over 78 years—the rupee in general has been decreasing in value with respect to the US dollar. Now, whether that’s a good or a bad thing is for the economists among us to argue.
I am just looking at the data. If you notice, there is a period between 2002 and 2007—the only period when the rupee strengthened, perhaps because of the massive FDI/FPI flows and increasing forex reserves during this time. This was also a golden period for the Indian IT services. Post that, we’ve never seen a single year like that. Here’s the link with the data if you would like to play with it.
Lastly: I was reading about the current status of the US-India trade deal—seems it may continue to be in limbo for a while. What the article says is that there is a fair bit of pressure to open up Agriculture for GM crops, and buy US Oil products such as Aviation Fuel and Ethanol. It is a good read if you are interested in understanding what’s happening on the trade deal front.
What to Expect in the Coming Week
Next week is the fourth week of December, and we’ve got just four trading days with the 25th (Thursday) being an off day for Christmas.
So SENSEX monthly expiry moves from 25th Thu to 24th Wed. NIFTY has one more weekly expiry on 23rd, Tuesday, before its monthly expiry on 30th, Tuesday. There are no other scheduled economic events for the week.
With the positive price action on Friday, my hopes are up again for a Santa rally. Let’s see. This year in general hasn’t been the best, so I will keep my expectations in check.
And on that sobering note, we come to the end of this week’s market metrics episode.
And yes—don’t forget to subscribe to the channel.
Until then—stay curious, stay steady, and have a great weekend!
See you soon!