Hello and welcome to Weekly Market Metrics!
We’re in Week 50 of the year—just two more weeks to go in 2025!
Incidentally, I was reading this article in Psychology Today about “Time perception” and age. Science actually supports the idea that we feel time is speeding up as we get older. The article also suggests ways to solve for it—if you want to nerd out on that, here is the link.
Over to the markets—and it’s time for our weekly dose of market metrics.

NIFTY saw a volatile week once again, with selling pressure in the first half, followed by a recovery toward the end of the week. After making a fresh swing low early in the week, the index bounced sharply from lower levels and managed to close near the 26,050 mark. Felt as if the markets reacted late to the Fed’s 25 basis point rate cut news.
Even after the late recovery, NIFTY remains stuck in a broad consolidation zone, with neither bulls nor bears taking full control yet. The market is showing some signs of stabilization, but a clear directional move is still missing.
So, is this recovery as seen in the past two days strong enough to push the index higher, or are we setting up again for more range-bound action in the coming week? Let’s get into the charts and break down how the price action played out, and what levels really matter going forward.
As always, Nifty first.
NIFTY 50 - Technical Analysis
Weekly Timeframe

After printing three consecutive green weekly candles in November, NIFTY has now formed two back-to-back red candles on the weekly chart. During the week, NIFTY fell 140 points, around 0.53% to close at 26,047. It made a low of 25,693 but somehow managed to hold above the 26,000 mark by the close.
This 26,000 zone has become a big psychological level—it is clearly acting as both support and resistance. But the bounce from the 25,700 area and a near 350-point recovery does give some hope for the coming week. But honestly, the chart still doesn’t show any real bullish strength.
NIFTY needs a clear close above 26,200, and only after breaking the all-time high near 26,325 can we start talking about a proper upside move.
NIFTY traded in a 485-point range this week, about 1.85%, which is very similar to last week’s 435-point range. This looks like a possible follow-through of the hanging man candle, unless we see a strong close above this week’s high in the 26,180–26,200 zone. That area is the first resistance, followed by the all-time high near 26,325. These are the levels to watch.
On the downside, immediate support lies around 25,900–25,800, and below that, near this week’s low around 25,700.
For now, my weekly outlook on NIFTY remains sideways, unless we get a clear close above the highs of the previous two weeks.
Daily Timeframe
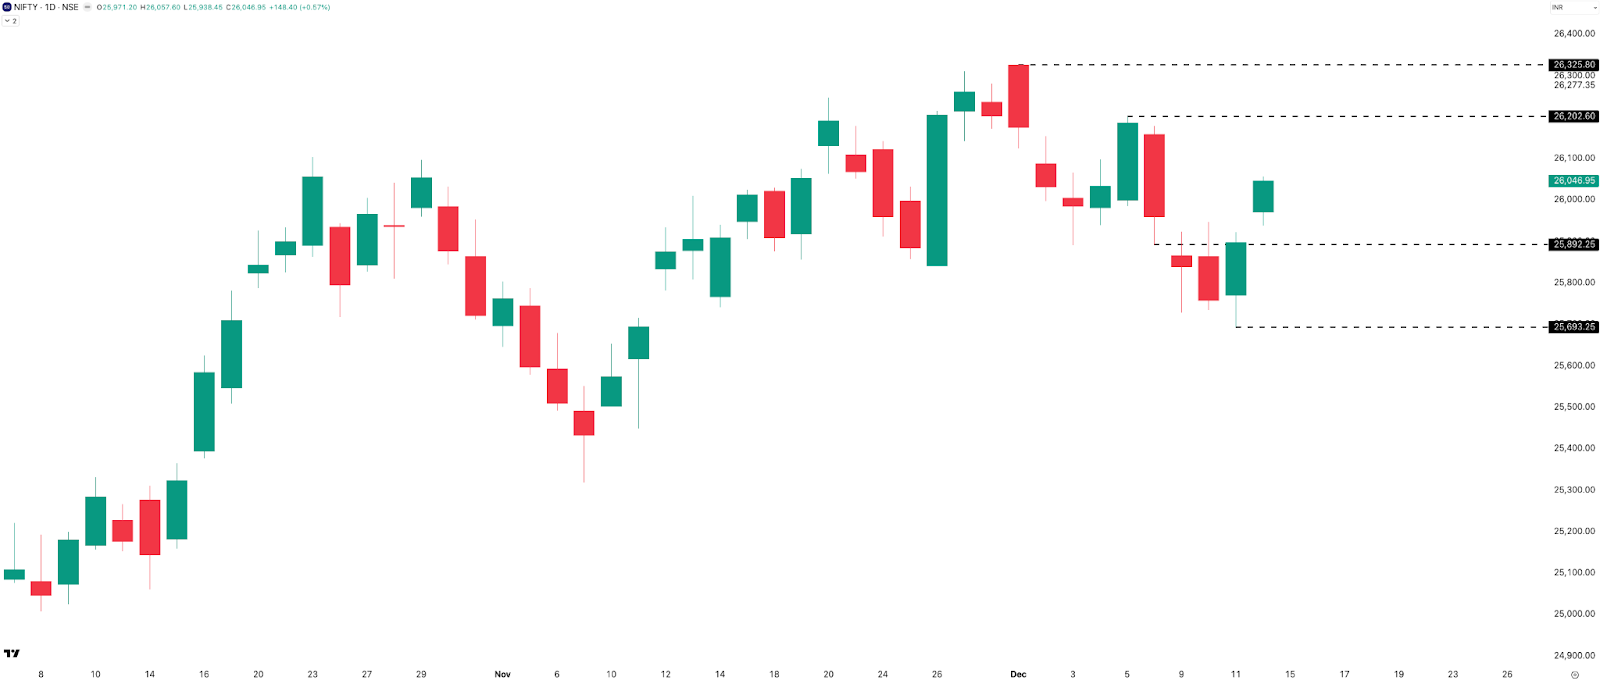
Just like the last two weeks, the pattern repeated again. The first half of the week was completely negative, followed by a recovery on Thursday and Friday. This week, NIFTY printed three consecutive red candles on Monday, Tuesday, and Wednesday, and then two green candles on Thursday and Friday.
On Thursday, NIFTY even made a low of 25,693. From that level, it bounced back nearly 350 points and managed to close around 26,050.
Resistance levels remain similar to what we’re seeing on the weekly chart—first at 26,200 and then around 26,325. On the downside, support is at 25,900, followed by a stronger support zone at around 25,700.
As shared earlier, until NIFTY manages a daily close above the 26,150–26,200 zone, the broader bias remains sideways. For now, I see NIFTY stuck in a range between 25,900 and 26,200—roughly a 300-point band—where the index may spend some more time consolidating.
Hourly Timeframe
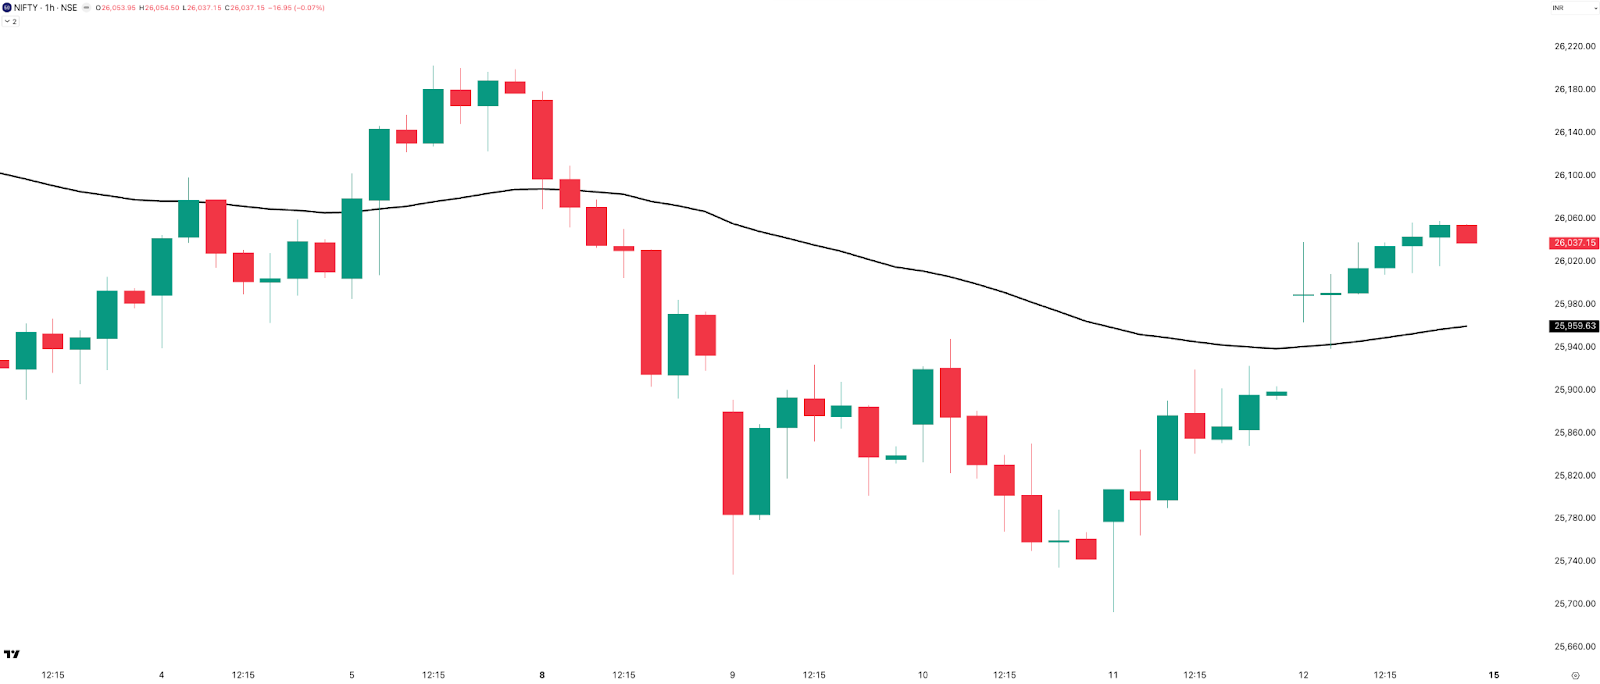
On the 1-hour chart, NIFTY stayed below the 50 EMA for most of the week, and then surprised everyone with a gap-up opening on Friday, moving back above the 50 EMA.
This is exactly why short trades in trend-following markets often feel like a mirage—profits look good on the screen, but actual realization is usually very limited. Anyone who has been trend-following on the Nifty would know what I mean.
By the end of the week, NIFTY is trading roughly 90 points above the 50 EMA, while the EMA itself is near 25,950. Now the key level to watch is 26,000—if this level holds, we could see continuation, otherwise we may once again get choppy price action around the same zone.
Overall, the short-term bias, based on the hourly chart, remains positive.
Overnight vs. Intraday Moves
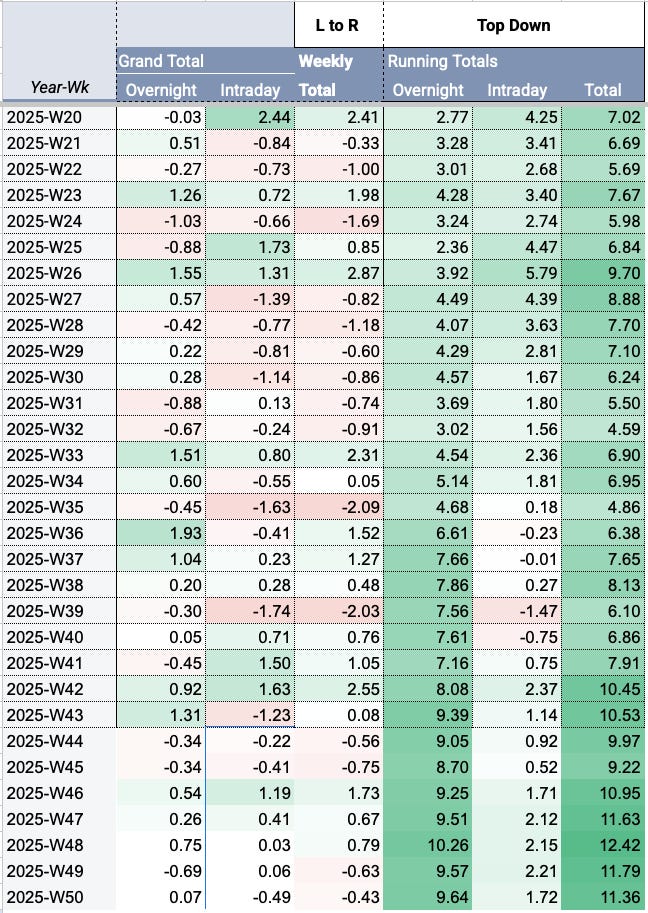
There’s honestly not much to talk about here. It’s the same story for the last seven weeks, with muted overnight gains. The gap-down opening on Monday was completely negated by the gap-up opening on Friday, and the week ultimately ended with just +0.07% in overnight gains and -0.49% on an intraday basis.
For CY 2025 so far, NIFTY has delivered +9.64% from overnight moves and only +1.72% from intraday moves—numbers that have essentially gone nowhere over the past seven weeks.
NIFTY Range Till Expiry
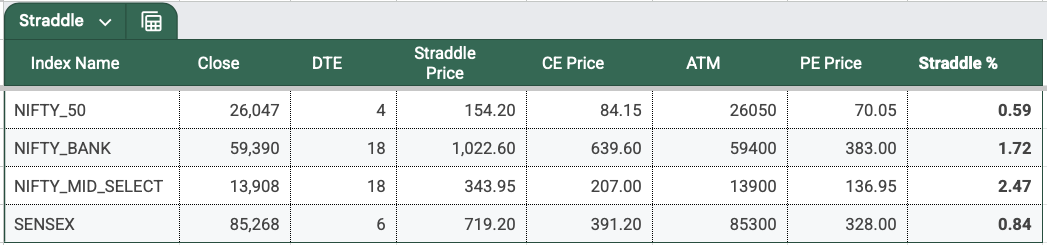
From this week onwards, I’m also tracking the straddle price to estimate NIFTY’s expected range till expiry. Currently, the 2 DTE straddle is priced at 154 points.
What this implies is that NIFTY is likely to expire on Tuesday, 16th Dec, around:
- Upside: 26,047 (spot) + 154 = 26,201
- Downside: 26,047 − 154 = 25,893
So, this gives us a broad expected range of 25,900 to 26,200. Interestingly, this is very similar to the range we identified earlier using the daily chart.
Open Interest Analysis

Now, from this week, I’m also going to talk about Open Interest—yes, you heard that right—but let me clarify how I’ll be using it.
I generally don’t rely on OI to mark ranges or define support and resistance because in a highly liquid index like NIFTY, OI changes very quickly during a move. On top of that, the data itself is delayed by about 2–3 minutes, which makes it a lagging indicator.
The only real information OI provides is where the maximum contracts are positioned. I won’t blindly treat these strikes as support or resistance. However, if these OI-heavy strikes align with my chart-based levels and range analysis, then I may consider them.
So I would think of OI purely as a confirmation tool, not a primary signal.
For this week, both 26,000 PE and 26,000 CE have the highest Open Interest. What does that suggest? Possibly, that option writers are expecting the market to stay sideways and expire somewhere around the 26,000 level. Let’s see how that plays out.
SENSEX - Technical Analysis
Weekly Timeframe

After printing four consecutive green weekly candles, this week finally closed in the red, giving up 445 points or 0.52%. However, it also formed a long lower wick. What does that tell us? Sellers attempted to push the index lower, but buyers stepped in strongly around the 84,150 zone and lifted the index nearly 1,000 points from the lows to close near 85,268.
Similar to NIFTY, this kind of price action points to a sideways bias for now. A clear bullish bias will emerge only above this week’s high around 85,700, and then above the all-time high near 86,150, which will act as a major resistance.
On the downside, the bias turns bearish below 84,500, and especially below 84,150.
Daily Timeframe
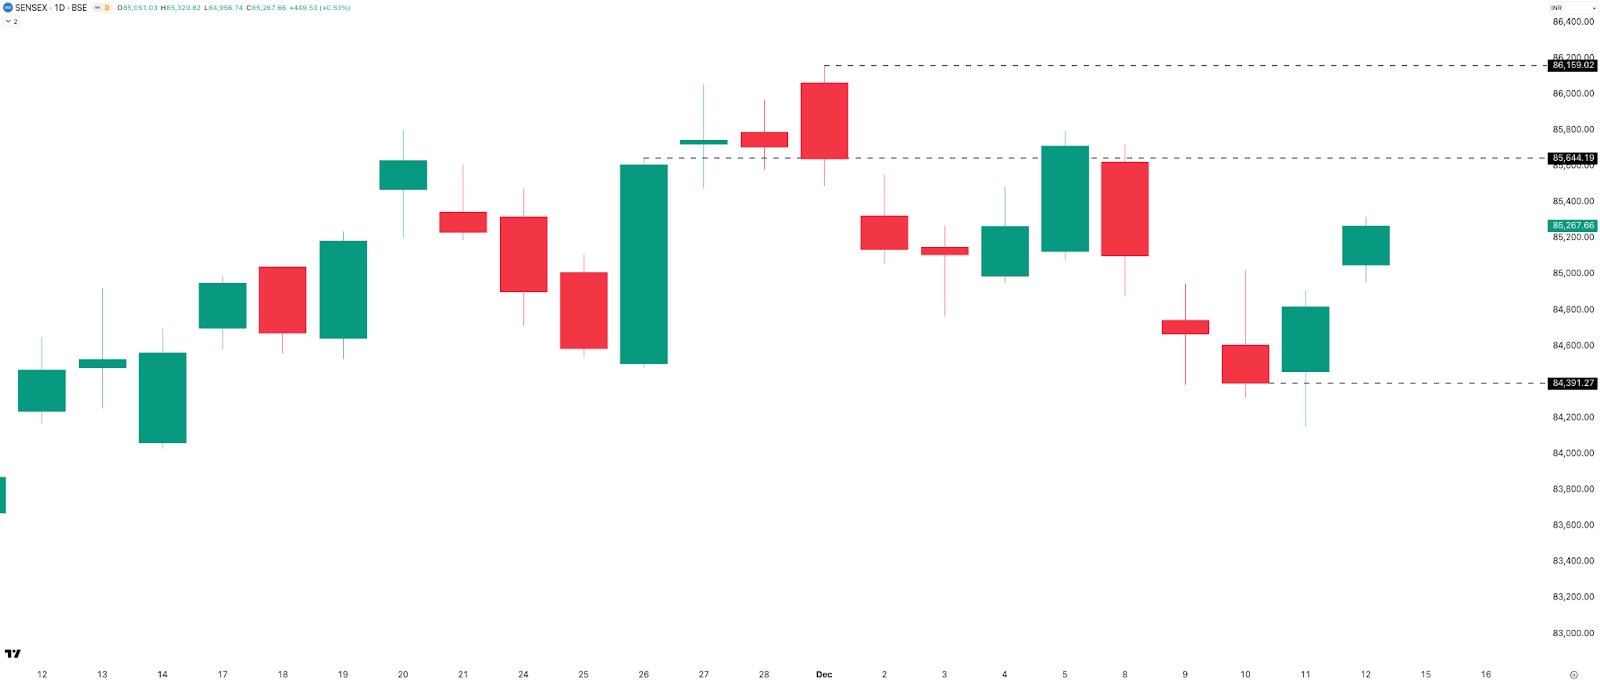
The story is similar to NIFTY—the first three sessions were red, followed by some recovery on Thursday and Friday with green candles. SENSEX appears to be stuck in a range, with 85,650 acting as immediate resistance and 84,400 as key support. The next major resistance remains at 86,159.
Overall, the bias for SENSEX continues to remain sideways.
SENSEX Expected Range Till Expiry
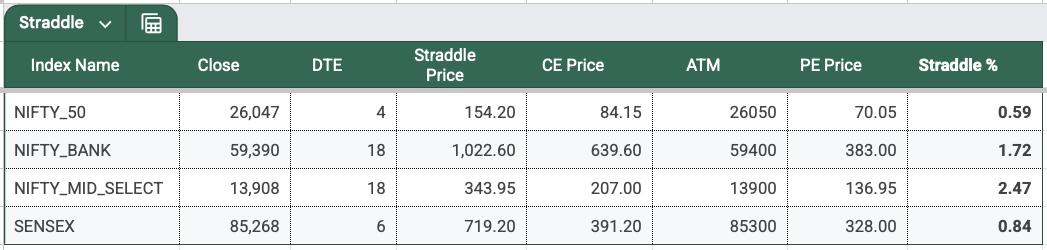
SENSEX ATM straddle closed at 719 points, which gives us the expected range till expiry:
- Upside: 85,268 + 719 = 85,987
- Downside: 85,268 − 719 = 84,549
So if you’re trading weekly strategies, these are the key levels you should be watching.
BANK NIFTY - Technical Analysis
Weekly Timeframe

BANKNIFTY lost 387 points, or -0.65% to close at 59,390. This week’s range was around 913 points, nearly 23% lower than last week’s 1,200-point range. What does that tell us? Range is contracting after six straight green weekly candles, suggesting the index may be pausing or consolidating.
On the upside, resistance remains at the all-time high of 60,114. On the downside, support is placed near this week’s and last week’s lows around 58,800, followed by 58,600.
Overall, BANKNIFTY continues to remain sideways on the weekly chart.
Daily Timeframe
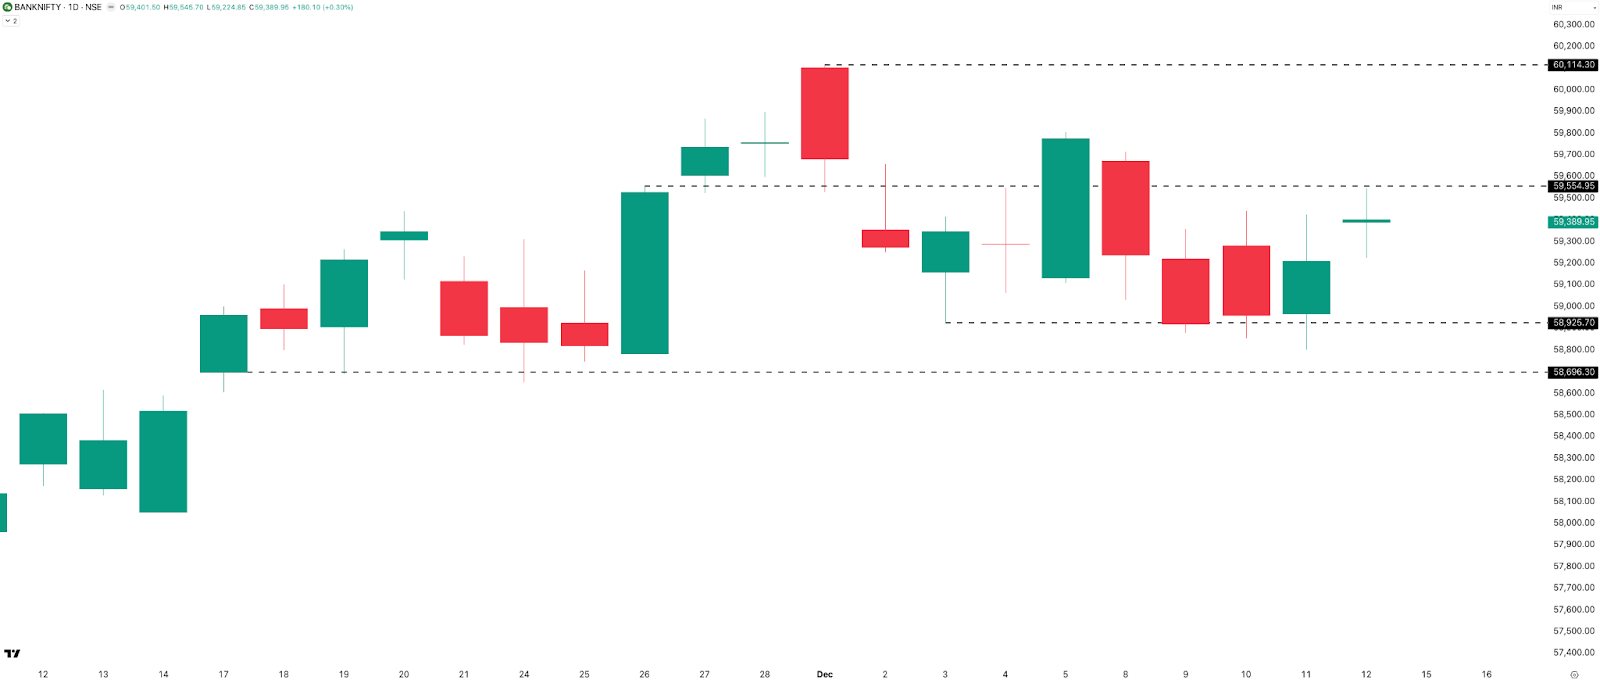
BANKNIFTY printed red candles on Monday, Tuesday, and Wednesday, followed by two green candles on Thursday and Friday. Price faced rejection near the 59,550 zone on Friday, making it the immediate resistance on the daily chart. Friday also made a doji candle.
Above that, the all-time high at 60,114 remains the next major resistance. On the downside, supports are placed at 58,900 and 58,700.
Overall, the trend remains sideways, with BANKNIFTY stuck between 59,550 and 58,900—a range of roughly 650 points.
Hourly Timeframe
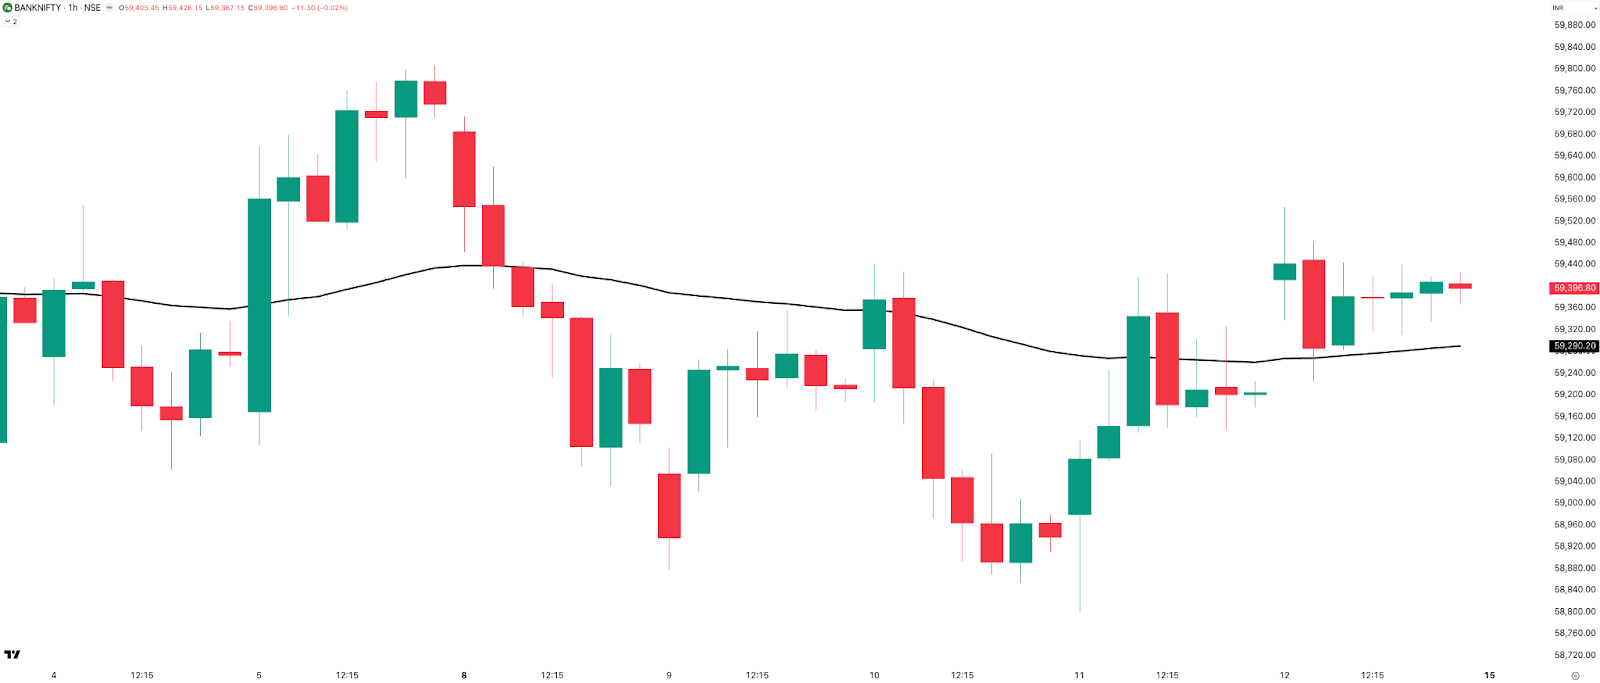
On the 1-hour timeframe with the 50 EMA, BANKNIFTY chopped even more than NIFTY. That’s always the case with Banknifty; its price action is seldom as smooth as Nifty. Banknifty attempted to move higher on Wednesday and Thursday but failed to sustain the move.
On Friday, it finally moved above the 50 EMA, but the price action remains pretty weak, with the index trading only about 100 points above the 50 EMA, which is currently placed near 59,290.
So overall, the bias for BANKNIFTY remains sideways across all three timeframes—weekly, daily, and hourly.
Market Metrics Summary
Rate of Change (Weekly Performance)

It was a flat to negative week across all indices, with WTD returns around -0.5%. We can call it a consolidating week. All four indices continue to sit close to their all-time highs, except for Nifty Mid Select, which is weaker compared to the rest.
Now that we’re so close to the end of 2025, let’s talk about year-to-date performance: BANKNIFTY leads with +16.7%, NIFTY follows at +10.16%, SENSEX sits at +9.12%, and MIDCPNIFTY trails slightly at +7.75%.
Directional Bias
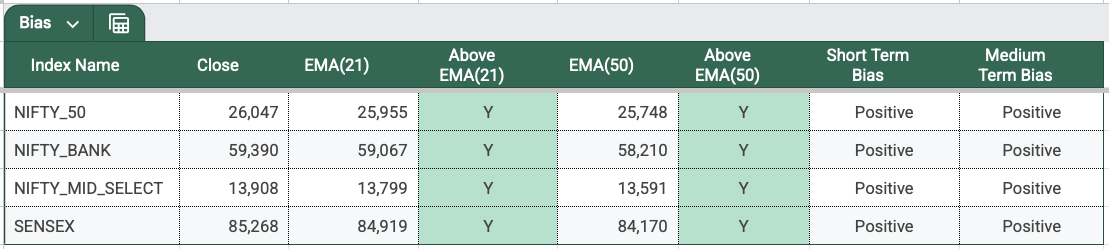
Just like the past three weeks, all four indices continue to hold a positive short-term and medium-term bias, with price staying above the 21 EMA and 50 EMA on the daily timeframe. Even if some indices appear sideways to bullish, the directional bias based on the slow and fast EMAs is still clearly positive.
Sectoral Performance

Metal continues to be in the top five sectors again this week, along with Auto from the previous week. The rest—Commodities, Energy, and Infra—are all new entrants this week.
I remember, W44 (the last week of Oct) had a very similar structure. Nifty closed at 25,700 that week. The coming week, things flipped. Markets went down actually, and we had a complete theme shift except for PSU banks holding up. But don’t read too much into it, it’s just an observation. Let’s see how things shape up next week.
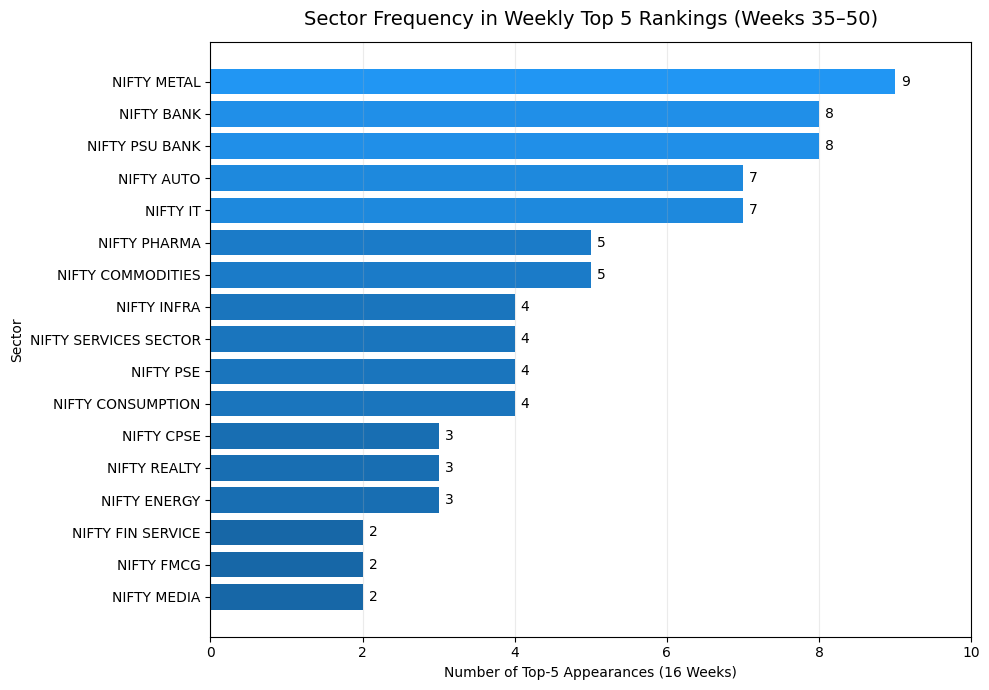
There’s another interesting thing I observed. I plotted the sectors based on the frequency of their occurrence in the top five rankings. Metals showed up 9 times, Bank and PSU Bank 8 times, Auto and IT 7 times, and so on. That gives us a sense of the key trends in the past 16 weeks. If you are a stock picker, this is where you will find names.
Volatility & Derivatives
Range & Expiries
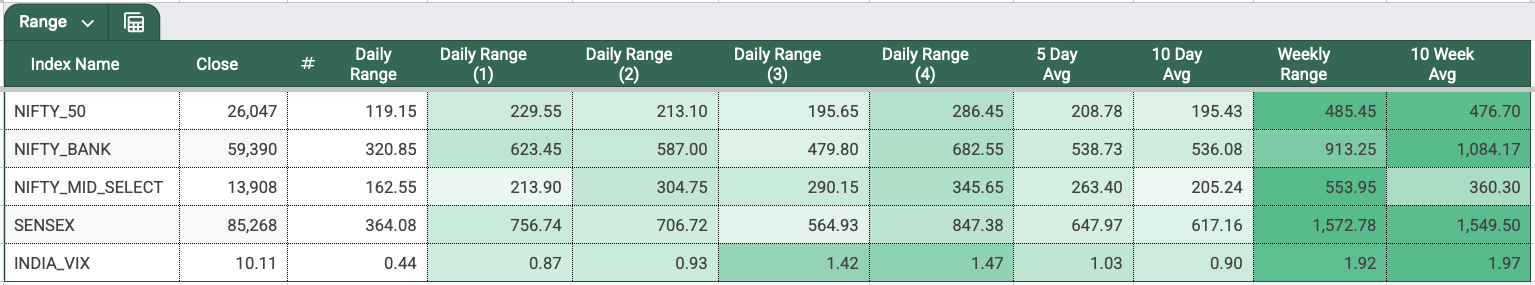
After last week’s volatile Friday, this Friday turned out to be the lowest daily range day for all four indices. Monday was the highest range day for all four indices. NIFTY’s 5-day average range rose to 208 from 182 last week, confirming a volatile week, while the 10-day average range remained similar at 195.
Now, let’s talk about the NIFTY expiry—this week’s NIFTY expiry opened with a gap down, followed by continuation of the down move. The first 10 minutes saw an 80-point recovery, but the rest of the session was a clean downtrend with lower highs and lower lows on the 5-minute timeframe. I’d rate this expiry 5/10 for sellers, where 1 is easy, and 10 is hard.
SENSEX expiry on Thursday created morning mayhem, with the index moving over 500 points in the first hour and then dropping nearly 470 points till 2 PM. The first half was tough for sellers, but the second half offered good opportunities for short volatility trades, especially with combined premium or MTM-based stop losses. I’d rate it 4/10 on the easy-to-hard scale.
India VIX
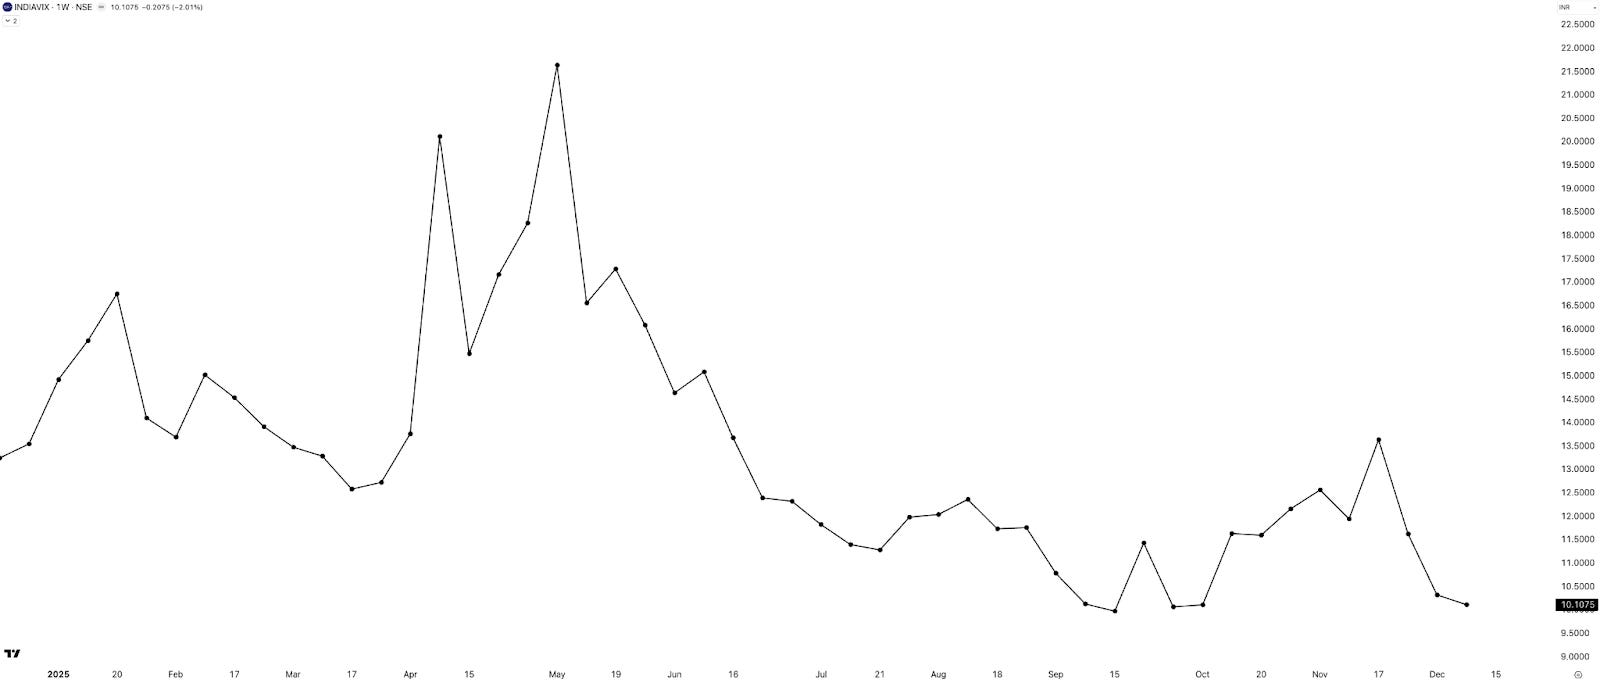
INDIAVIX remained almost flat, down 0.2 points or 2%, closing at 10.1. A low VIX indicates no fear in the market—let’s see what next week has in store.
Commodities Update
(Data: MCX Continuous Futures - Back Adjusted)
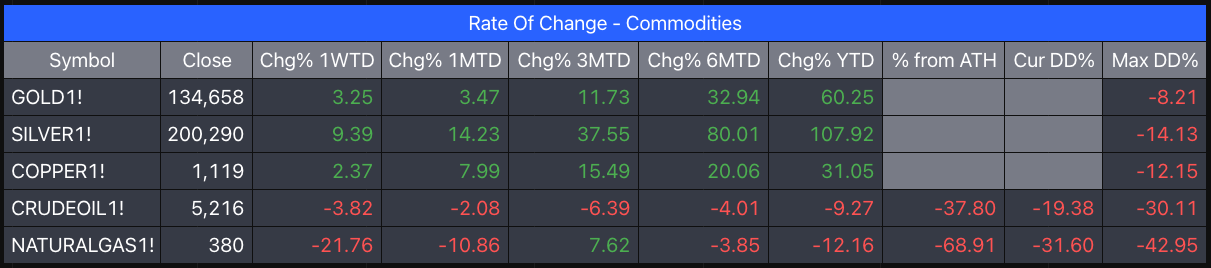
The commodity pack this week was led by Silver, which was up by 9.39%. As of today, it’s sitting pretty at 108% YTD gains. If you are wondering what’s causing it, well, the little that I have read tells me that it’s a mix of factors at play. Some are pointing to a rise in industrial demand, and then there is FOMO-driven speculation as well. But remember, silver has historically been very volatile, so if you are in the long trade—stay cautious. In the precious metals circles, it’s called “the widow maker” as it can cause huge losses.
There’s a very interesting documentary-like episode about Silver by Markets by Zerodha - Hindi.
Gold and copper closed in green, up about 3% & 2% respectively this week. Crude oil was down 4% and Natural Gas was down a whopping 22%. NatGas does give some good trading opportunities on the short side.
That’s pretty much in the commodities this week.
Summary & Looking Ahead
The markets consolidated this week and the last two trading days, along with positive short-term bias on the hourly time frame, make me a bit hopeful. On commodities, it was a fabulous week for Silver and solid volatility in Natural Gas. It’s been generally an okay-ish week for option sellers. Hoping for better price action in the coming weeks. Let’s see.
What to Expect Next Week
Next week is the third week of December, and we’ve got a full five-day trading stretch. There is an ECB interest rate announcement, but that should not affect us much. With the Fed rate cut done, in general, the bias seems to be positive for the markets.
While for the month the broader indexes are in red so far, I think that should change and turn December to green in the coming weeks. Fingers crossed.
And yes, before I close, if you have been watching the weekly market metrics videos, and if you think you would like me to include certain data points that could be of interest to you for trading and active investing, do share them in the comments.
So that’s pretty much it for this week. And yes—don’t forget to subscribe to the channel.
Until then—stay curious, stay steady, and have a great weekend!
See you soon!