Bollinger Bands are multi-faceted trading indicators. They are price bands that are mapped below and above price.
They are used to analyze the market and the strength of reigning trends. They help traders decide during which range in the market should they enter it and find any possible market tops.
The Bollinger Bands adapt easily to the dynamic market conditions. Because of this feature of theirs, they are the preferred standard indicator by traders!
The exterior Bollinger Bands respond to change in prices. Strong trends and price fluctuations tend to expand them. And receding or trends of low momentum and sideways consolidations contract the bands.
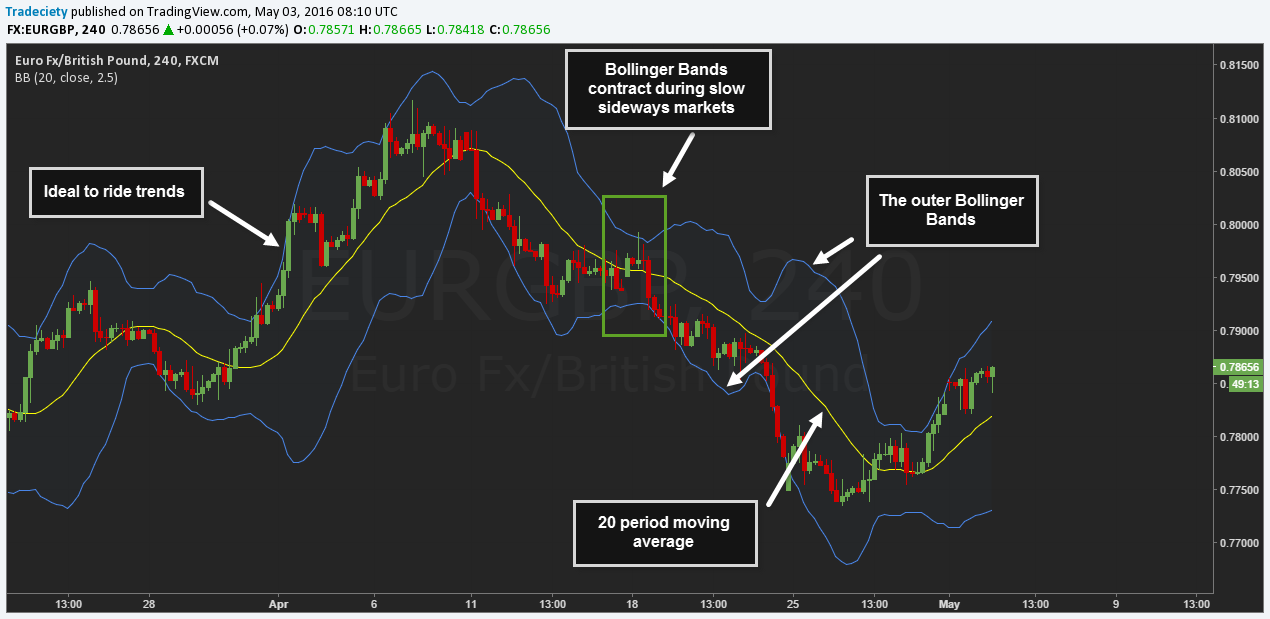
The default Standard Deviation setting of Bollinger Bands is 2.0. The moving average of 20 periods is taken as the median of the Bollinger Bands.
If the price touches the outer band once the SD is fixed at 2.0, it indicates notable price extremes.
I would suggest positioning the Bollinger Band SD to 2.5. This would widen the scope of the band because you will then witness approx 99% of the price action in it. But most importantly, any price volatility touching the outer boundary of the band would become that much more significant!
Another suggestion for when you analyze the trend strength using Bollinger Bands is to do it in combination with RSI indicator.
RSI indicator helps identify a couple of quirky tops:
-
A price surge that reaches the outer bands and rebounds immediately is indicated by a ‘Reversal signal,' and
-
When a moving trend fails to send its price to the band's outskirts, it starts to fizzle out. RSI Divergence indicated this along with the ‘Continuation signal.'
Bollinger Bands, RSI, and moving averages together provide a dynamic trading strategy to the traders.