Pay off charts:
Pay off on a position held by a market participant is the likely profit/loss that would stem with the change in the price of the underlying asset at expiry.
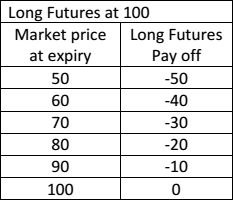
Pay off for buyer of futures: Long futures
Lets say a person goes long in a futures contract at Rs.100. This equates to him agreeing to buy the underlying at Rs.100 on expiry.
On expiry, if the price of the underlying is Rs.150, then the person will buy it at Rs.100 as per the futures contract and can immediately sell the underlying in the cash market at Rs.150, thereby making a profit of Rs.50.
Similarly, if the price of underlying falls to Rs.70 at expiry, it would translate to a loss of Rs.30.
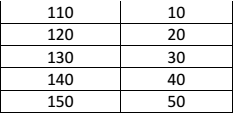
This potential profit/loss at expiry when expressed graphically is known as pay off chart.
The X axis has the market price of the underlying at expiry. It increases on the Right Hand Side(RHS).
The Y axis shows profit and loss. Above 0 shows profits and below 0 shows losses.
The below table and pay off chart show long futures pay offs:
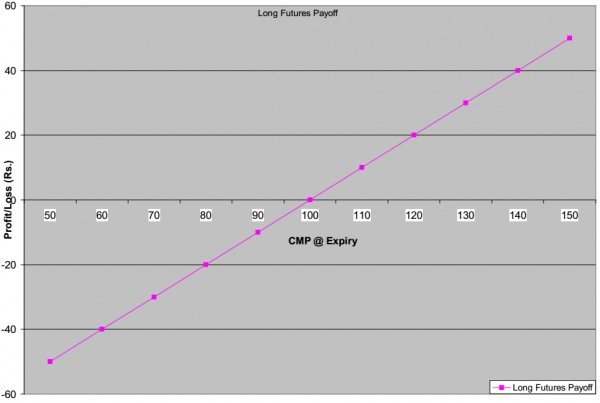
Pay off for seller of futures: Short futures
While one person goes long, in order to execute the deal, another person has to short.
The profit and losses for the short futures position will be exactly opposite of the long futures position.
The below table and pay off chart show short futures pay offs:
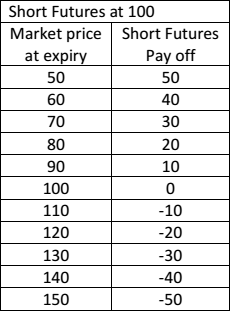
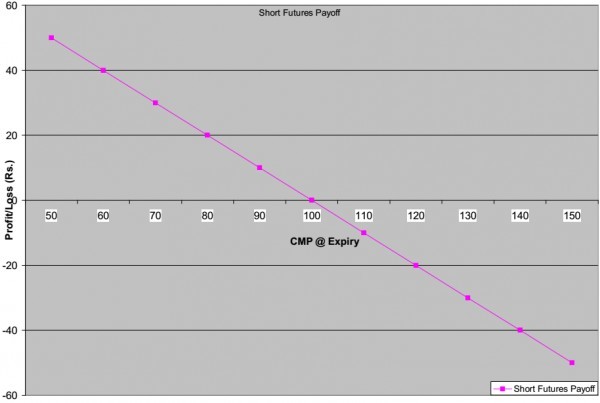
From observing these charts, we arrive at the fact that a short futures position makes profit when prices fall. As shown in the above chart, if prices fall to 60 at expiry, the person who shorted at Rs.100 will buy from the market at 60 on expiry and sell at 100, thereby making a profit of Rs.40.
This is shown in the chart.
Cheers!