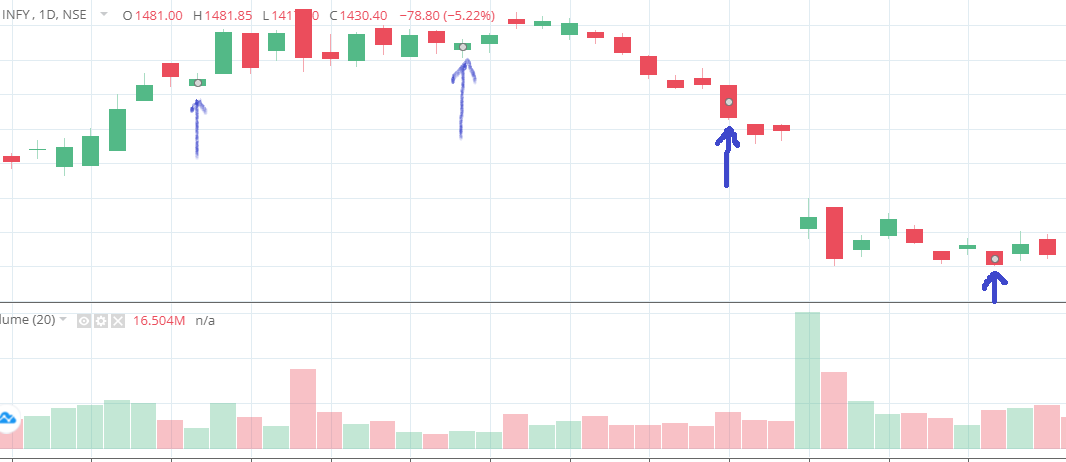
Has anyone else noticed these small grey circles on the Trading view Charts (see pic below as eg). They generally appear on the price candles or volume bars when you click on the candles or on the volume bars. What do they indicate? Can they be turned off?
They appear to indicate divergences, but I am not sure.
2 Likes
I have observed that.
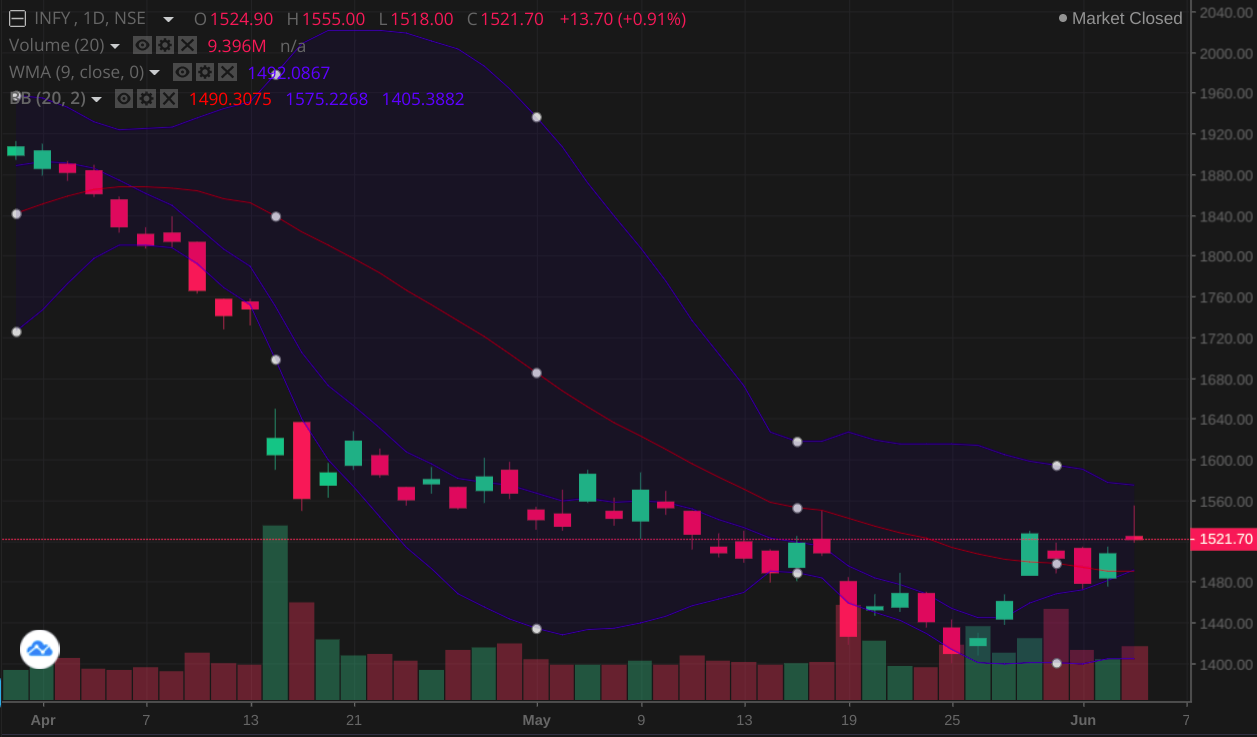
They are always present at 10th consecutive candle in all time frames, that means they don’t indicate any price action or volume action, something like that.
Its real purpose is to point out the indicators you have selected. You can observe this when you have multiple indicators. When you haven’t applied any indicators, the circle will appear exactly middle of the candle.