By far, the most common base pattern we have seen in studying the greatest stock market winners over the past 50 years has been the cup-with-handle formation . Other base patterns that have resulted in stocks with big price advances are the double bottom, the saucer with handle, the flat base, and the very rare high tight flag.
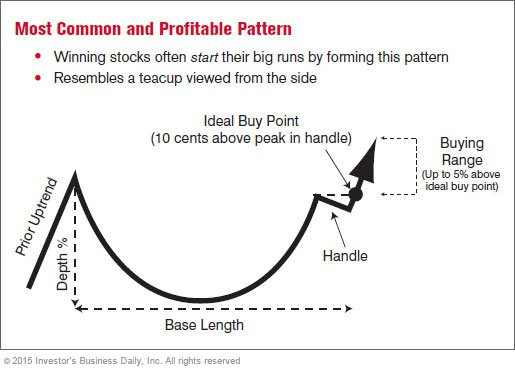
The Cup with Handle Base Pattern
What to Look For in the Cup-with-Handle pattern.
a. A prior uptrend of at least 30%
To form a proper chart pattern, you have to have a previous uptrend. The idea behind bases is that after making a decent run, the stock begins forming stepping stones as it takes a breather and prepares for an even higher climb.
b. Base Depth: 15%-30%
The depth of the base measured from the peak on the left of the cup to the lowest point of the cup - should be between 15-30%. In a severe bear market, the depth may be 40% - 50%. As a general rule, look for stocks that held up relatively well during the market correction. So if one stock on your watch list dropped 35% while another’s base depth is only 20%, all else being equal, the stock with the 20% decline could be forming a stronger base.
c. Base length: At least 7 weeks
The first down week in the base counts as Week #1. The minimum length for a cup with handle is 7 weeks, but some can last much longer - several months or even a year or more. Be wary of any pattern that has the shape of a cup with handle but is only, say, 5 weeks long. That’s typically not enough time for the stock to consolidate the prior gains, and such bases have a higher chance of failing.
d. Handle:
Volume in the handle should be a light depth of the handle should be 10%-12%, should form in the upper half of the base. The peak of the handle should be within 15% of the old high on the left side of the cup.
The handle should be a mild pullback on relatively light volume. It’s a shakeout of weaker holders - those not committed to holding the stock longer term. A sharp decline of more than 12%-15% on heavy volume could indicate a more serious sell-off that might prevent the stock from launching a successful move.
The handle should form in the upper half of the base. If it begins building too soon (i.e., in the lower half of the base), it could mean institutional buying, right now, is not as strong as it needs to be to push the stock higher.
Who are the weaker holders getting shaken out in the handle? Typically, they’re investors who bought late, right at the end of the prior uptrend (See Point 1, above). When the stock sold off to form the left side of the base, they suffered a sharp loss. Getting a profit is no longer their goal. They just hope to recoup some of their losses. So as the stock nears that old high - and the weaker holders’ break-even points - they start to sell.
Here’s why that shakeout is healthy: If you have a lot of weak holders in stock, whenever the share price rises, they jump in to sell, which pushes the price back down. Once they’re out of the picture, it’s easier for the stock to move higher.
So, what about the big investors who’ve been picking up shares as the stock formed the right side of the cup? They’re more committed and are holding onto their shares. That’s why the volume in the handle is light, Only the weaker holders are selling. The large institutional investors are sitting tight in expectation of a new upward climb.
e. Ideal Buy Point: 10 cents above the peak in the handle
Buying Range: Up to 5% above the ideal pivot point.
For best results, buy as close to the ideal buy point as possible. If you’re not able to watch the market during the day, you can set conditional orders ahead of time. Those trades get automatically triggered if the stock hits your target purchase price. Ask your brokerage service how to set those up.
Don’t Buy Extended Stocks
Once a stock climbs more than 5% above the pivot point, it’s considered extended or beyond the proper buying range. Stocks often pull back a bit after a breakout. So if you buy extended, there’s a higher chance you’ll get shaken out of the stock because it triggers the 7%-8% sell rule.
f. Volume on day of breakout: At least 40%-50% above average
On the day a stock breaks past its ideal buy point, the volume should be at least 40%-50% higher than average for that stock. That shows strong institutional buying. On many breakouts, you’ll see volume spike 100%, 200% or more above average. Light or below-average volume could mean the price move is just a head fake, and the stock is not quite ready for a big run.
It’s important to recognize the significant influence of the general market on individual stocks. It is not uncommon for the individual chart patterns to reflect the action of the overall market. As to why such patterns often result in successful price advances, remember that chart patterns ultimately represent the actions of buyers and sellers in the marketplace, and as such reflect human emotions. For example, when a stock forms a sound cup-with-handle base, it encompasses the actions of weak holders that often get scared out of the stock near the low, and the accumulation of shares by strong holders as the stock forms the right side of the cup. Further, the handle represents the shakeout of the last weak holders who sell just before the stock begins its major advance.
To learn more about chart patterns, check the Investing University section in www.marketsmithindia.com.