Hello,
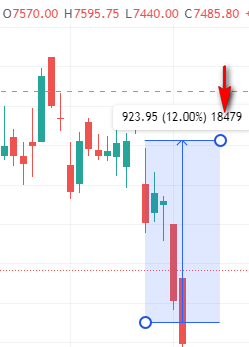
On tradingview, i drew a random price range and saw 3 values appearing. First one is price movement/difference.18479 . What does that indicate? Can someone let me know.
cvs
June 1, 2022, 5:44am
2
Hmmm… whatever it is,Price movement/difference in your above screenshot.
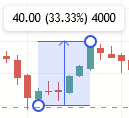
When i tried the same on Tradingview,
For me it’s 20 times.
The third value is the change in price in terms of pips or ticks
Ticks:
Ticks are similar to pips, but they’re used in other markets like futures or stocks.
They represent the smallest price movement that a particular contract can make.
For example, if a stock’s price moves from $100.00 to $100.01, that’s a 1 tick increase.
So, when you see the third value in the price range tool on TradingView, it’s telling you how many pips or ticks the price has moved!