Hi everyone. These days im so confused as everybody is talking about pattern breakouts and all. I just want to know what are all the patterns that can be seen on an Intraday chart. I trade 15min charts and i trade on pivot breakouts and pullbacks.
Patterns are same irrespective of the time fame one uses. Any pattern (technical, candlestick or others) can be applied to daily, weekly, 5 min, 15 min, hourly or any other time frame charts.
A pattern breakout is referred to as an event wherein the stock moves outside the range of a developing pattern.
Example, lets say Reliance is trading between 810 and 820 over and again for the last 1.5 hours…and all of a sudden Reliance trades at 825. This means that Reliance has broken out of an intraday range and is likely to trade higher.
The pattern above is referred to as the range breakout, likewise there are multiple patterns including the ones you mentioned - head and shoulder, triangles. A breakout could happen in either directions.
Each pattern has something called as an measuring implication (MI). MI gives you a sense of how much the stock is likely to move after it breaks outside the range.
Also, it is important to remember that a breakout should be backed by good volumes.
There are various candlestick patterns which may help one to decide market direction, trade continuation and reversal. You can find some illustrated example of candlestick patterns in this nice article
Thanks alot for your quick reply Ajay.
How can one approach the market if he doesn’t see any pattern on the chart but his analysis is giving some direction to a particular stock?? How can we know whether the pullback is at the end phase? I Know its impossible to spot whether the pullback is over or not, but i just want to know what are the strengthening signals that we can see when the stock is in a pullback in an uptrend.
I hope im not bothering you with my long list of questions. :))
Thanks again.
How can one approach the market if he doesn’t see any pattern on the chart but his analysis is giving some direction to a particular stock??
Patterns are not must to take a trade though they are helpful.
Though there may not be any visible patterns on the charts one is monitoring, there could be some good patterns on different time frame chart.
Patterns also can fail.
Having said that trust your analysis more than any thing else. If you have done all the research and have come up with some conclusion about the direction of the market and planned some trades, then follow them. But at the same time be flexible since even well analyzed trades can fail, so stop loss is a must. Its not that the analysis was wrong. Its just that this particular trade did not work, may be due to some new information. So though you may have firm belief about the direction of the stock be on watchout for warning signals.
Remember “The eyes see only what the mind knows”. So when we have bullish bias, its very easy to miss strong bearish signs and signals while even weak bullish signal will act like an easy confirmation of our belief. Also when in trade, judgement gets hindered by emotions and it becomes difficult to take decision. Hence do the best research analysis you can, plan the trade (entry, stop loss, target, position size etc) before hand and then just follow the plan.
How can we know whether the pullback is at the end phase?
In simple terms any bullish candle, close or signal could mean end of pullback. Higher close would confirm the signal.
Remember the biggest advantage of pullback trades is that they present very low risk high reward trading opportunities. One favorable trade takes care of several failed ones. One has to realize the trade is not working when a new lower low is made. Having a SL below the prior low at appropriate level is must.
Though it is not possible to get it 100% right following are guidelines that I follow to increase the odds.
Unless the trend in very strong, 1st attempt to reverse usually fails. Odds increase with each subsequent attempt. Each failed attempt to resume the trend, increases the odds that pullback could change into trend in opposite direction (except for trading range pullbacks).
Distance between each subsequent lows. If it decreases then odds increase. This is especially true for 3 push patterns like wedge. e.g. if 1st low was at 100, 2nd low at 60 (distance of 40) and the next one is at 45 (distance of 15).
If the lows are approaching some kind of support, then the probability of reversal increases. Stronger the support and more the number of supports, stronger the odds. These supports can be anything n-Day MovAvg (S, E etc), SuperTrend, TrendLines, Bollinger Bands, Fibonacci Retracement and Extension Levels, Pivot Points, Current Open and Lows, Prior Periods Close and Lows, Prior Swing Low etc.
Any strong signal at strong support is a trade worth taking.
Look at the individual candle, look at context (preceding several candles) and look at the over all picture.
Big bullish candle is better signal then bullish spinning top then doji.
But if the size of this bullish candle is much smaller compared to preceding several bearish candles then this would mean a weak signal.
Bearish candles with long lower tails implies buying pressure. This increase probability of success of immediate subsequent bullish signal. At the same time a bearish candle near the lows with long upper tails implies that there was some buying pressure during that period though it was not strong enough. Thus a bullish hammer is stronger signal then bearish hammer then bullish inverted hammer then bearish inverted hammer.
Especially if these long lower tail candles are accompanied by very very strong volume, it could imply climatic sell-off and hence a very strong chance of trend resumption.
Any retracement of 50% of the last bearish candle is good signal. That’s the reason most of the candles patterns require 50% piercing of prior candle - piercing pattern, morning star.
Higher the retracement into prior candle, higher the probability. Thus a bullish engulfing is better signal than piercing pattern.
Look at size of subsequent candles. 3 big green candles are strongly bullish e.g. 3 white soldier patterns. But stalled pattern consisting of decreasing size of subsequent green bodies is not as bullish.
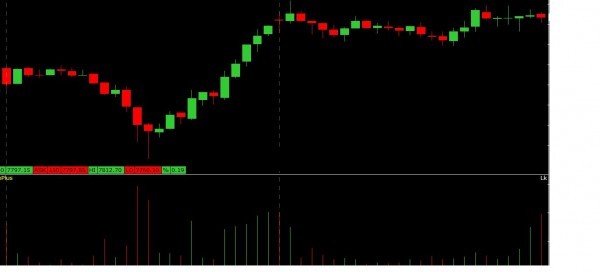
Attached (in my original reply) is the 2-days (Friday and Today), 15 min chart of July Nifty Futures. Count candles from extreme left. Here is how I look at the chart -
Candles 3-8 represent a very narrow trading range consisting of 2 legs. Each 2 red candle followed by green candle was a leg.
Candle 9 broke down from this trading range followed by candle 10 which was also bearish confirming the breakout. But look at the volume, it was quiet high compared to prior several candles, implying a possibility of climatic sell off and hence a reversal. Also this was near lows of Thursday’s trading range.
Candle 11 did attempt to reverse. Aggressive traders might have bought during this anticipating a bounce or a reversal since the risk reward ratio was favorable. But look at is body. It was small compared to candles 9 and 10. Also it was not able to retrace 50% of candle 10. Had this candle closed higher or the next candle (12) closed above it many Conservative traders would have entered driving the market up. But this confirmation did not happen implying bears were still strong and there could be one more leg down. Conservative traders usually wait for confirmation. 10 and 11 candle formed bullish harami pattern. This was the 1st attempt to reverse which failed.
Candle 12 was a big bear candle breaking out below the lows of yesterday’s trading range. It had a small lower tail.
Candle 13 was another bear candle but look at its lower tail and volume. Climatic sell off and 1st signs of buying pressure.
Candle 14 was a high volume hammer with long lower tail. Though it had bearish body, the probability of reversal were quiet high. This was 2nd consecutive climatic sell off (1st one was candles 9 and 10). There was more than 50% retracement from the lows. This only means there is possibility of reversal but does not mean it will.
Candle 15 again a small spinning top bull body. Some aggressive traders and some candlestick pattern followers might have jumped in while there could be some bears who try to fail the earlier hammer. Risk reward was quiet favorable here but confirmation had to happen yet.
Candle 16 confirmed the signal. It had a bigger body and closed not above the previous candle but also the candle before it. Risk reward ratio was also quiet favorable.
Candle 17 was a bearish hanging man. Considering this as 1st pullback in bear trend, some bears might attempt to resume the bear trend. But since the bullish signal was quiet strong, bulls would be expecting 2nd leg up and hence would continue purchasing.
Candle 18, 19 and 20 formed the 2nd leg up. There was a probability of bear trend resumption here since this was end of 2nd leg and near the lows of prior trading range (resistance) - a breakout pull back in a bear trend. Hence candle 20 was a bearish hanging man. But looking at size and volume of candle 18 and candle 20 made this probability slightly remote.
Candle 21 resumed the bull trend. Since 2 attempts to resume the bear trend had failed, bears gave up and we did not have any more bear attempts.
(Today, restarting the candle count at dashed line). Candles 3-6 represent a pull back in bull trend that began yesterday.
Candle 7 was a good bullish signal. Bullish engulfing pattern with longer lower tail. It also represented 3 push down pattern (candles 4 and 5 were the 1st 2 pushes while 7 was the 3rd push). On smaller time frame like 5 min, it might have been a 3 push down wedge pattern. Breakout above this is considered bullish.
Candle 8 did confirm the signal. One could have expected the up-move to test the day’s highs or may be even go higher based on A-B-C pattern from yesterday’s swing lows. But this trade did not work. In-fact there was no 2nd leg up which was expected.
When this type of thing happens, a good signal fails, traders usually step aside for quite a while unless there is another good signal, may be a test of prior low ( Candle 7 lows). They expect another leg down.
This resulted in a weak two legged bear channel move from candle 9 to candle 16. Candles 10 and 13 attempted reversal but failed.
Candle 17 was another signal which resulted in successful traded reaching day’s highs. It was bullish engulfing pattern with comparatively bigger body. It was also a double bottom with candle 7. Candle 16 and 17 might be double bottom on 1/3/5 min charts.
Hopefully this helps in understanding breakouts, pullbacks, failed trades etc.
Don’t wory you are not bothering us. You can keep asking such questions, it also helps us improve our knowledge while answering provided we know the answers
Do remember above are just my suggestions and way of looking at things. Like every one else I could be wrong as well.
Recommend to go through books and/or courses of Thomas Bulkowski (http://thepatternsite.com/) and Steve Nison.
Don’t forget the bible - Technical Analysis of Stock Trends by Edwards and Magee.
Also go through books and courses of Al Brooks. His stuff is one of the best on price action trading. Only thing it is bit dry and difficult to grasp. But if one can go through his all the four books, nothing like it.
lovely… very very informative …
Well if u traded nifty in friday and monday could we view ur trades as well … Just to know how professionals like u enter and exit on the same charts that we trade … (Mention the time of ur trades as well please)…
Thankyou
Verrrrrrryyy informative Ajay. Thank you so much for your guidance. Guys like you,Karthik, Nithin and others really keep me sticking to this page. Thanks alot guys.
Thanks alot karthik. Can you recommend me some books about this patterns and pivots. I have gone through john murphy’s technical analysis of financial markets. a little guidance from the experience traders like you will be helpful.