Please Explain what is the difference between Range Bars and Renko Bars? both looks similar.
Both Range and Renko are very similar. Range has bar size and Renko has box size. In both these charts a new renko/range is plotted based on price and not based on time like normal charts. So only if certain points of movement happens the next bar/box is plotted.
Assume a stock is at 100 and bar/box size is set to 2. Also assume that the current range of the bar/box is 98-100.
In Renko a new box won't be plotted unless the price goes to or above 102 (new green box range being 100-102) or to or below 96 (new red box range being 98-96).
In Range a new bar is plotted similar to renko. But along with it, in range bars, a new bar is plotted if the current range is also met. So if the stock moves between 100 to 102 another bar is plotted in the opposite color to the previous one.
So in renko the brick next to the current one is either above or below. In range it can be in the same level as well.
Check the images below
This one shows the range bars, check out the bars plotted which are flat in nature (highlighted on the chart)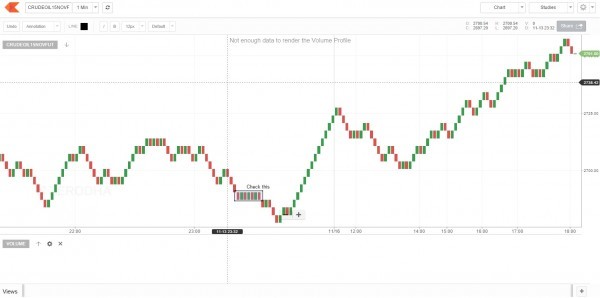
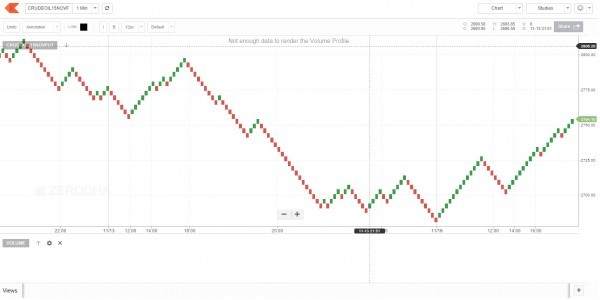
Check the Renko below, you will see no such flat renko's next to each other. Also this means that there will be a lot fewer renko's compared to range bars if plotted for the same duration and same box/bar size.
2 Likes
A question from algogeek :O… Aapko nahin patha tho kisko patha hoga? 
i think Renko’s goes based on Trend renko bar the range has to be all up or all down But, range bar measures a set range of price movements… expecting more explanation…
In Kite, I see that the Renko charts (auto range) are plotted differently when I select between 1 day or 15 min. I thought, Renko has nothing to do with the timeframe.
When you change time frame, the box size is essentially changing (nothing to do with time). You can change the box size yourself manually to anything you want.
The data for Renko is coming from candles. Ideally it should be plotted using live quotes not using Candles.
So when you change time frame the data also changes. It is always better to use 1Min Data for Renko because that is the lowest available. You need to set appropriate Brick Size. It can be based on fixed % or proportionately to ATR.