What's your most indispensable tool, utility, initiative or resource while trading? Why?

Contest#4, ending 23rd July 16

 What's your most indispensable tool, utility, initiative or resource while trading? Why?


To make learning fun, we are starting a contest on http://tradingqna.com/. One question is asked every saturday and the best answer will win Rs 10,000 in cash on the following saturday. 

Do participate and invite your friends. I am guessing will help all. Contest is open for everyone trading on the exchanges. We will contact the winners on the email address used to register while creating a tradingqna account.

We are not declaring contest winners based on who gets most votes.  So no need to down vote others to win. :) 

Click here to see contest #1 

Click here to see contest#2

Click here to see contest#3

Winner : prashant04125

@Prashant, we will contact you on the email ID that you have used to register for the cash reward. Alternatively, you can also reach out to us, send an email to [email protected].

17 Likes

Calendar on Forexfactory

Best place to keep a tab on all important news releases from around the world. Especially more important because a lot of news releases from europe happen during Indian trading hours.

Indian economic calendar on Tradingeconomics

Since I don't watch TV and most print media publish news after it is announced, it is important to know when the Indian macro data releases are scheduled. No fundamental analysis or technical analysis typically work around news. I plan my positions well in advance based on information here. 

Kite for trading

And of course Tradingqna for all my queries.

8 Likes

Most Indispensable tool:

Let me keep it simple with 5 points

1.Advance Decline Ratio

2.Put call ratio

3.Open interest watch

4.Fii dii participation on daily trading activity

5.Monitor the Global events and make sure it matches with trend before taking decision

2 Likes

All three things are equally important in trading to get consistant results.

THE MOST  INDESPENSABLE TOOL WHILE TRADING  FOR ME : 

.....  is my MINDSET  ,

1) THE ONLY PERSON WHO IS MY  ENEMY WHEN TRADING IS  " ME " ( MY  MINDSET ) , ,most of the people make mistakes while trading when they let their fear/greed takeover their sane minds , thats where we start to become our own selfs enemies 

2) WE GENRALLY SPEND MOST OF OUR TIME IS SEARCHING AND LOOKING FOR THE PERFECT TOOL ,, STRATEGY THAT CAN MAKE US VERY RICH IN NO TIME , BY DOING THAT WE ARE JUST FOOLING OURSELVES AS THERE IS ARE NONE 

3) HENCE BEFORE I ENTER INTO A TRADE ( EVERY MORNING ) I SAY A FEW AFFIRMATIONS , THEY ARE LISTED BELOW 

     a) THERE IS NO SHORT CUT TO SUCCESS 

     b) I M A TRADER NOT A SPECULATOR 

     C)  NEVER HURRY INTO  A TRADE THINKING I MIGHT MISS THE TRAIN            IF I DONT ENTER NOW )

     D) THERE IS NO HOLY GRAIL IN TRADING 

     E) RISK REWARD BASED IS THE ONLY TOOL IN TRADING 

      F) NEVER GET OUT OF THE WINNING TRADE QUICKLY N FOLLOW 

          STRRICT STOPLOSSES 

AND FINALLY 

     G) I M NOT HERE TO GET RICH IN A DAY OR A MONTH ,ITS MOST IMPORTANT TO ENJOY THE JOURNEY , STICK TO THE BASICS , DONT COMPLICATE TRADING BY ADOPTING TOO MANY TOOLS , USE THE TOOLS ONLY FOR CONFIRMATIONS AND THEY SHOULD NOT BE USED AS MAIN SOURCE FOR INITIATING THE TRADE ITSELF .

WITH WHATEVER PROFITS YOU MAKE DONT FOR GET TO DONATE OR FEED FEW POOR PEOPLE DAILY , LOVE AND RESPECT ALL .

ALL THE BEST TO ALL MY FELLOW TRADERS ,

THANK YOU .


10 Likes

What Tool- ME, Why -Common Folks its me okay cant leave him behind,

What Utility- Zerodha PI, Why - 20Rs per trade and such a software aur koi nahi deta.

What Resource- Quick order. Why- i don’t even remember the last time i entered the price, Thnx to my friend Quick Order.

1 Like

My most indispensable tool without which I cannot be successful is “Trading Calls/Tips”. Wherever there is a buy call, I open that scrip and see if I can find a potential sell setup as per my strategy. Cheers…

9 Likes

My most indispensable tool/utility/initiative/resource while trading are as follows-

  1. I use screener.in for getting quick information, news, fundamentals, technicals etc. about particular scrips/contacts after the market closes.

  2. I use tradingview.com just for alerts, they sent alerts to my email if it crosses my prescribed value.

  3. I keep Zerodha Pulse open in my trading hours. I also watch it 15 mins before market opens to have some basic information about that particular day.

  4. At night, I see world’s indices and also preview my trading strategy. I also focus on my particular scrips which I like.

  5. I downloaded some apps which are useful to me like JStock, My Stock Portfolio, Stock Edge, ETMarkets and NSE Stocks Manager.

  6. I also see the websites of NSE India Live Market Equity Stock Watch at nseindia.com to see nifty 50 stocks. This helps me a lot.

  7. Last but not least, I use kite.zerodha.com and kite app for trading. Sometimes I also use Pi, it depends.

Let me rest my fingers here.
Happy Trading.

6 Likes

I know this will sound like i am trying to flatter ZErodha Management but i am not .

I use only PI when i trade from a fixed place , Kite for trading on the move and RSI for my Trading thats it along with little bit of Price Action around Support And Resistance . Thats it no news , no tips , no tv , etc no nonsense watsoever which can distract me and my judgement . And i forgot to mention My favourite 50 period moving average which is the best indicator of medium term trend . My whole Idea about Trading Tools is " LESS IS MORE " , keep it small , keep it simple and try to reduce risk whenever a Opportunity arises during a active ongoing trade .

2 Likes

no matter how much news you watch, how many calendars you track and how much technical analysis you do....it all boils down to how you act to the actual market behavior.   

Just because you tracked US and Asian markets and have made your opinion about how nifty should open/behave - you already have become biased and when wrong can be challenging.  

What is important is to know how to act with the flow of the market than react based on preconceived ideas.  

2 Likes

The Most indispensable tool / utility / initiative / resource for entering a trade  to me are:

-

Combination of two or more of the following  will definitely attract me towards that particular scrip.​

-

1.  Volume  -  Breakout ( including spike in Delivery based trades ).

-

2.  Insiders Buying / Selling activities.

-

3. Prolonged Bollinger Band squeeze  setup... the indicates impending big movement.

-

4. MACD / RSI / ADX  reached too low or too high points - as per one's own parameter in a particular time frame.

-

5. Change in interest of Big Sharks - Fund houses in a particular scrip / index.

-

6.  Filtering out a particular scrip / or / particular sector  that defies  over all market trend

-

These are all primary drivers / factors  that define how successful one is, in trading.  Because,  if I quote a famous saying **  It does not matter whether One is right or wrong in their perception - but it does matter how big the profits are when we are right  and  how low the losses are when we are wrong**

Other Macro tools  -  that I will keep watching on -  

Just to have a feeling of Overall market momentum / Trends  are:

-

A.  Put Call Ratio.

-

B. Open Interest .

-

C. Ensuing policy changes of Governments... 

-

D.  Social unrest -  Natural disaster  -  Natures' boon that could affect overall mood  of market trend... or  overall momentum on a particular sector.

-

While these macro factors  may not  affect a particular sector  or  particular scrip where one is having high interest;  it is always prudent to keep an eye on them, so as to enable us  to initiate necessary mid-term course correction proceedings.

Wish you all safe and profitable trading.

1 Like

No Heavy Trading Jargons, Still Two essential things.

  • Charting Software: Any Charting software which gives realtime data for different strategies, with a good technical support.

          To get an Edge in market, one need to be at least one step ahead from majority,                                    Charting software provides that edge. 

  • Reliable Broker : A Good Relationship with Broker is must, A Broker who               can resolve problems offline quickly  when anything goes wrong online.

There can be many Indispensable tool, utility, initiative or resource while trading for a particular person :- -------

  • Volume
  • Moving average
  • Social cause
  • News
  • Charts
  • Trading Tips
  • And many others, list continues....

==============================

As in for me also there are many Points but the one thing that attracts me is ---- "52 Day Week & High".

Several people here say it doesn't help or is insignificant, but they haven't investigated this indicator fully. 

No number in a stock table is a complete story in itself.

-------------------------------------------------------

"What is a 52-Week High/Low"

A 52-week high/low is the highest and lowest price that a stock has traded at during the previous year. Like me many traders and investors view the 52-week high or low as an important factor in determining a stock's current value and predicting future price movement.

A popular strategy used by stock traders is to buy when price exceeds its 52-week high, or to sell when price falls below its 52-week low. The rationale behind this strategy is that if price breaks out from the 52-Week range (either above or below) there will be enough momentum to continue the price move in a favourable direction.

Alternatively, another strategy is to sell when price reaches its 52-week high on the assumption that price will recede, or to buy when price reaches its 52-week low in anticipation of a value play. Traders and investors typically conduct additional technical and/or fundamental analysis for confirmation.

High:-

Share prices are obviously rising as the stock heads toward its annual highs. However, some investors become nervous that the 52-week high represents a high-risk price level since share prices have not exceeded this level in a year, and sometimes longer. This psychological barrier or resistance prevents many investors from opening positions or adding to existing positions, while encouraging others to sell some or all of their existing shares.

It is an interesting dynamic since a rise in the stock price probably reflects good news. Perhaps sales are up, profit is increasing, or the future earnings prospects are bullish. Yet, despite this news, the powerful mental barrier of the 52-week high keeps prices compressed – at least for a while.

But generally, if the news is good and the fundamentals are strong, these factors eventually prevail and the stock breaks past the 52-week high. Once it breaks through, share volume will vastly increase and the coiled stock typically makes a jump in excess of average market gains.

Here the research of a data analysis company :-

  • Small stocks crossing their 52-week highs produce 0.6275% excess gains in the following week
  • Large stocks crossing their 52-week highs produce 0.1795% excess gains in the following week
  • Small stocks crossing their 52-week highs produce 1.8963% excess gains in the following month
  • Large stocks crossing their 52-week highs produce 0.7035% excess gains in the following month.

After doing some research, I found out that the great majority of stocks that retrace away from the 52 week price high or low, but come back to break the 52 week price high or low tend to continue moving in the same direction about 65 percent of the time.

What does this mean to you ? simply if you wait for the market to bounce away from the 52 week price high or low and give it another chance to break out, the odds of your trade continuing in that direction is very high.

Final Word:-

The 52 Week Range: Make sure the stock is trading closer to the 52 week low than the high and also has upward momentum.

"Traders' reluctance to revise their priors is price-level dependent. The greatest reluctance is at price levels nearest and farthest from the stock's 52-week high. At prices that are neither near nor far from the 52-week high, priors adjust more quickly and there is no pronounced predictability when information arrives".

Whether you prefer to trade based on the 52-week high effect or not, the anomaly is real. The excess gains from this effect are most pronounced over very short periods of time, and the largest profits are made on thinly traded stocks with little coverage (i.e. small and micro- cap stocks).

Regardless of whether you choose to trade this phenomenon or not, the 52-week high has transformed itself into an important anchoring point in the minds of many investors, and has significant effects over share prices.

Here is what I understood from this strategy/tool/resource :-

52 Week Strategy

One thing I observed over the years is markets tend to get volatile when they approach and break through the 52 week high/low price point.

The reason for this volatility is because the 1 year high/low area is the centre of focus for many traders including professional hedge funds and mutual funds who put a lot of weight into the 52 week high/low price.

The Basis For The Set Up

A while back before the time when everyone had access to the Internet and traders were a bit less sophisticated, the 52 week high/low point was known as a breakout point where markets broke out and continued moving in the same direction with continued momentum.

With time as more traders caught on to this method to buy as well as sell near the 52 week high/low price, markets began demonstrating more and more false breakouts near this price level. As a result the 52 week high/low began losing all credibility as having any type of edge that could benefit traders or increase their odds of winning.

Different Way To Trade 52 Week High/Low

After several years of monitoring how markets behave near the 52 week high/low price levels, professional traders realized more often than not markets hit the 52 week high/low area and pulled back before once again approaching the area and breaking out with strong momentum the second time around.

To take advantage of this price action, I created a great day trading strategy that uses the 52 week high/low price points without subjecting me to the draw downs and pullbacks that occur near these price levels.

Find Markets That Touch Their 52 Week Price High/Low Level

You want to start by finding Stocks, Futures or Forex markets that are touching the 52 week high/low price level. You want to find markets that are not edging slowly towards the 52 week level but are gravitating towards that level with increased volatility and momentum.

The more volatility and momentum you notice near these levels at least initially the better. In this example you will notice how the stock approaches the 52 week level like a magnet. You should also make sure the markets you pick have sufficient volatility under normal trading conditions; therefore you should pick your markets carefully.

learn to day trade

This Stock Really Wants To Hit The 52 Week High Level

Monitor Market After False Breakout

Once the market hits the 52 week high/low level you should see an instant pullback away from that price range. The market should then take anywhere from 1 to 3 weeks to consolidate and try again the second time to break through the 52 week price high/low level.

In this example the stock quickly pulls back and consolidates for about 2 weeks before trying once again to reach for the 52 week high level.

learn to day trade

The Stock Pulls Back And Consolidates For Two Weeks

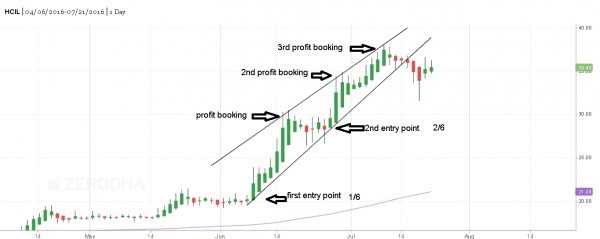
 Monitor Entry Levels

As you monitor the market daily notice and keep track of the high that was made the day the market made the 52 week high/low price initially. Your job will be to enter an entry stop order each day  that initial 52 week high/low price.

You only want to enter the order for the first hour of the trading day. The breakout that should follow should be very powerful and tends to occur near the opening bell. I rarely see breakouts that occur late in the day that have sufficient momentum to make the trade worthwhile. If you are not filled during the first hour of the trading day you should cancel your order ASAP.

You can see in this example how the stock gaps up and doesn’t turn back down. The volatility should be similar to what you saw during the first time the breakout occurred.

learn to day trade

The Stock Rallies About After The Second Breakout

Intra-day View Of The 52 Week Pop Strategy

In this example you can see the entire trade progression from beginning to end. The entry occurs $0.25 higher than the 52 week price high. In this case the gap occurred at the opening bell and we were filled substantially higher.

This is not something you should be too concerned with because usually momentum coming from gaps near the 52 week high levels tends to follow through similar to this example.

Once you are filled you need to place your stop loss order below the low that was made the day prior to your entry.

learn to day trade

The 15 Minute Bar Charts Works With Stocks

52 Week Low Example

In this example you can see how the stock makes the initial 52 week low. This is when we begin monitoring the stock for the next 1 to 3 weeks to see if it pulls back up and goes for another try to break through the 52 week low level. I suggest you trade to the downside just as often as you trade to the upside.

The momentum is typically stronger and quicker to the downside as opposed to the upside the majority of the time.

learn to day trade

We Begin Monitoring The Stock Once It Makes The Initial 52 Week Price Low

In this example the stock only pulled back for 6 days. The pullback is usually quicker to the downside as well. Notice how the breakdown below the 52 week low was volatile and once again started with a small gap. The gap is not a necessity but you will see it often when trading this strategy. The second breakout below the 52 week low tends to carry strong momentum.

Learn to day trade

The Stock Gaps Down And Continues Moving Down Till The End Of The Day

The Entire Sequence Intraday Chart

You can see the entire sequence of the trade to the downside. In this example I use two different stocks but the 52 Week Pop Strategy works just as well with Commodities, Futures and Currencies. I’ve been trading this strategy using Precious Metals and Currencies for over a decade with consistent results.

learn to day trade

The Stock Closes Near The Low Of The Day

Things To Keep In Mind

When trading the 52 Week Pop you should use 15 minute bar charts the day you intend to enter the market when trading stocks. For other markets I tend to use 5 minute bar charts but stocks respond well to 15 minute time frame. I always use the daily chart to isolate the pattern and make sure that it’s setting up correctly. Once the set up is correct and my order is entered I switch to the shorter time frame to make sure the pattern is developing accordingly.

My stop loss is placed a few cents below the low prior to your entry day breakout day. The market should never go back to this level if the trade is working out as planned. Also keep in mind that you should never enter the trade after the first hour of the day.

This method thrives on momentum so if the market doesn’t start out that way in the morning the odds are it won’t begin during the trading day. Lastly, make sure you keep the trade open till the end of the day to give yourself the highest odds of achieving maximum profit potential.

And in the End Wordings are :-

“ You’re neither right nor wrong because other people agree with you. You’re right because your facts are right and your reasoning is right-and that’s the only thing that makes you right.”

3 Likes

This is my first post on the Trading QnA forum and I am really ecstatic to be a part of the community. I really like to thank Zerodha for the contest which they have started for the participation of the trading community at large which otherwise is not possible. I went through the previous three contests and found the content very informative. I really appreciate the enthusiasm of the Zerodha community. I would like to congratulate the winners and all other members for their participation.

3 Likes

 I started trading in 2014 after my retirement mainly to spend time. My ITR IV for FY 14-15 was processed with a loss of 50% of my capital, ITR IV for FY 2015-16 for loss of 20% of my capital is under process and ITR IV assessment for FY 2016-17 has shown a gain of 50% of my capital(up to June 2016). The 2 years of experience has helped me realize that I was a winner in the game that never ends.                                                                                                                Following quotes/ads/notes  helped me for this minus to plus experience and you may call them as indispensable tool/utility/initiative/resource etc., etc.,

  1. Enjoy the fun of trading and the thrill of the chase, but not with your retirement nest egg, -  John Bogle,Vanguard’s founder, wrote in “The Little Book of Common Sense Investing,”
  2. Ignore analyst buy/sell recommendations. No one knows what the market is going to do tomorrow, next week, or next year -  Wall Street analysts
  3. The truth is that trading, both successful and unsuccessful, is more about psychology than tactics. – Jack Schwager
  4. I’m always thinking about losing money as opposed to making money. Don’t focus on making money, focus on protecting what you have. – Paul Tudor Jones
  5. Everyone has the brainpower to make money in stocks. Not everyone has the stomach. – Peter Lynch
  6. It is not necessary to do extraordinary things to get extraordinary results. By periodically investing in an index fund, the know-nothing investor can actually outperform most investment professionals.- Warren Buffet
  7. Soch Kar Samajh Kar Invest Kar -  ad by  National Stock Exchange Of India
  8. We neither encourage, nor tolerate posting of stock and trade tips. - a note by Zerodha
1 Like

IF u say indispensable, it is as follows

  • A device with internet connection,while another idle connection in backup.(secondary handy device on the go)

  • tool = most loved ZERODHA kite for graph analysis

*utility = zerodha PI for placing orders(mostly bracket orders)

*initiative = Go with the trend and that’s all (By drawing lines and analysing higher time frame to lower timeframe graph)

*resource = pulse for current big news that can shake the market

*why = I love trading ,its like a secondary game for me where i play 1 VS millions and its fun to play with greed and fear

Keep the winning mindset at all cost.Dont mind those small scratches ,it will make you a better trader than before.

1 Like

We often tend to blame our luck when our trade goes wrong. But behind that, there is a piece of information we are missing which makes us go wrong on that trade. Whether it be an information from a trading indicator or an earnings surprise, it makes an impact on the stock we trade. The ticker constantly reacts to each and every information it receives. So, information is the most important tool for a trader to be successful. The more informed one is, the better the chances of translating a trade into profit. For being as informed as possible, here’s a list of trading tools I tend to keep a check on:

  1. Business Newspaper: Now this is very important to keep a check on markets. One should know what news and market updates are playing on the stock he/she trades. I prefer “The Economic Times”. For people who trade around the world markets, “Economist” is the best I feel.
  2. Market Sentiment: I do watch out for the market guru’s to gauge the overall sentiment of the market, rather I look out for the Put/Call ratio, open interest, some basic moving averages & Volatility Index.
  3. Events Calendar:  India is impacted a lot on what happens in the global markets. So, one needs to keep a check on both global and India specific economic events.  I use trading economics for keeping a check on the events to come.
  4. Fundamentals: We usually have a notion that fundamental check of a company is done for investing and technical for trading. I don’t agree. Fundamentals too play a vital role in trading. Fundamentally strong companies often tend to outperform the weak once, but with technicals, both would have generated a signal. Screener.in is the best free website to keep a fundamental check on the companies. One has a whole bunch of fundamental ratios that are automatically calculated so that one can filter the best ones.
  5. Charting Software: One should have a proper charting software and a trading system to make the most out of the markets. In this case, Amibroker is the best. The advanced charting system provides every trader an opportunity to customize the trading system according to his needs. By exploration systems one could select few buzzing scripts from thousands of stocks that are listed.  From pivot point to complex trading system, anything can be built in Amibroker. Kite- by zerodha is also a game changing web charting platform.
  6. Options Oracle: Options oracle is a freeware with which one can build complex options trading strategies according to his/her risk tolerance. It provides detail of different option greek of different strike price all at one single page. I have been using this freeware from past 2 years.
  7. Analyzing Past trades: When I started trading, 8 years back, there were no advanced tools like Q-Zerodha to analyze the past trades. I maintain excel sheets the “Van K Tharp” style. I was highly motivated by the book “Definitive Guide to Position Sizing” back when I read the book 5 years ago. I still follow the R Multiple format rational in analyzing my past trades. Apart from that I have a trading diary in which I write the mistakes I have done in the past and make sure that I do not tend to repeat them.

Hence, I would conclude that information has been the most indispensable tool a for me

7 Likes

I am a short term trader ,my indispensable tool and utility is my strategy which help me to trade without being emotional ,greedy or fear. I use 1:2:3 rule  .

1.First i find a stock which have a long-term growth perspective. 

I use EPS,P/E ratio,market capital,Mutual fund holding ,balance sheet and a 45 degree chart in one year to find that kind of stock.

2.To take initiative-

i will explain it with an example, i have a total capital of 12,000  , i divide it into 4 parts that is 3000 each ,now i can use each part to invest in one particular stock. Here the rule is ,always save  last part of your capital for emergency that is 1/4 or 25% of my capital . after it's done now i am going to apply 1:2:3 rule for buying stocks.

->  first  i need to  analyse  the one day chart of that particular stock ,so i try to find the near support in one day chart by using line technique . then i will take one part from my total capital that is 3000 ,and  i will invest it partly by using 1:2:3 rule .when i will find the near support , that will be the first entry point and i will be investing only 1/6 of 3000 that is 500. if stock goes down then i will invest 2/6 of 3000 that is 1000 in next support level. if again stock goes down by any reason then i still have 3/6 of 3000 that 1500 to invest in next supports level. If stock goes up then i will book profit at near resistance level that is  30% of total capital i have invested , Again stock will come down to it's near support level ,so there i will buy 3/6 of 3000 that is 1500. So it's a continues process, you buy at near support and book profit at near resistance partly.


            My resource is my capital or money  because who has the money he has the power to buy stocks , so never put your total capital in one stock , by using partly buying technique you can be relaxed and wait for the stock to get lower levels where you can  buy more . this technique has very  low risk and can give you 20 to 50 % of profit if you have selected the right stock.

Last but not least  HAVE PATIENCE !

1 Like

Screener.in is an Equity Investor’s best friend. I use it all the time to check metrics, ratios and see what type of stocks are outperforming the most. Screener is a finance portal for Indian investors. It focuses on providing tools for stock analysis based on fundamentals.

Of course, there are other tools you could use to analyze your stock, but they’re not as valuable as Screener.in for two reasons.

First, Screener.in is free. The price can’t be beaten.

Second, Screener is a tool designed by Dalal Street that also gave us the most popular stock filter for Indian Stock Market. I’m not able to track down any relevant stock filter site for the Indian market.

Beyond that, Screener offers a wealth of information you can use to improve your stock research. It makes it easy to check financial ratios, compare the stock with its peers, keep track of company announcements and financial statements.

Basically, Screener is awesome.

Obviously, I use several tools to track stock and analyze it. But I strongly recommend Screener.

If you’re investing for a long time then you need to know a thing or two about Screener.

I want to give you three simple, straightforward, and actionable tips that make it an excellent and my best tool.

Here’s the thing about Screener: all those numbers and metrics serve a purpose. They tell a story. They give you instructions.

The purpose of the screener is to show you what’s going on with the company and what needs to change.

Investing isn’t a guessing game. One shouldn’t have to wonder: Is this working? One should know each and everything about stock before investing. That’s what screener help us to do.

So, below are some things I’m about to show you about screener that give me an accurate read of a long time

Minimal Navigation Interface

If you had ever visited the site then you might have noticed there top navigation bar for each stock. It’s very helpful to go to and fro from one metrics to another quickly, saving the time to analyze stock.

Export in Excel

It also provides service to export all the data to excel file for further processing. It is very helpful to me as sometimes I use my own formula to calculate values. Most importantly, screener allows us to tweak the file as per own specifications.

Quick Ratio Lookup

Best thing I ever like about this site. At the upper fold of the page, you can see basic statistics of stock at a glance which makes it easier to decide whether the stock is worth giving more time or not. Even it allows customizing stats as per our wish. Its database contains more than 120 ratio lookups.

Pros & Cons

Screener has its own intelligence query which automatically sort out the pros and cons of every stock based on their financial statements. Like Company has low-interest coverage ratio, Company might be capitalizing the interest cost, Company has been maintaining a healthy dividend payout of 27.55% etc. Below is a snapshot:

Peers at a glance

It provides a feature of comparing the stock with its top 7 peers companies. Sometimes it helps me to find other stocks which are out of date excellent stocks. Also, you can customize the comparison metrics of all peers as per your choice.

Create your own query and share

This is also an innovative feature. You can filter stock by execution of more than 120 ratio metrics. Save it and share it with other people. Here’s my Query - Bargain Hunt.

No adverts

Generally, every website who are receiving high traffic monetises website with stinky ads like moneycontrol (They’ve almost 5-6 ads per page). But thank GOD! Screener doesn't accept adverts and hoping will not accept it in future.

Track of announcements

At the end of the page, you can find recent announcements, annual reports and credit ratings related to stocks with relevant external links. Isn’t it good to get every relevant information at one place?

Email notifications and alerts

You can also set an alert and email notifications of your stocks in wish-list. Get notified about stocks on every morning. And of course, it’s free service.

Hope it’s enough to prove its usefulness.

I would like to answer this question from the perspective of a pure technical trader.
Most people think that keeping up to date with the news and other info can give them an edge , i like to think otherwise.
The market reflects all available information and by the time the news is out, it is already reflected in the price.
The best one can do is stay out of the market when very high volatility is expected.
And there are High Frequency Trading systems sitting very close the the exchange that can use such info to their advantage.
I am not saying taking advantage of a news isn't possible, just very difficult for a normal retail trader.

For a technical trader, the trading boils down to three simple steps :

  1.  Data collection and assimilation
  2.  Running or back-testing strategy on the input data
  3.  Execution of trade

While most brokers give a mix and match of the above three,none can qualify to be complete.
Zerodha is coming close to providing a complete solution.
Till then I have my very own state-of-the-art combination of tools, developed around Ninjatrader for this.
The tool consists of
a) Data server (RTD client / Scrapping tool )
b) Ninjatrader
c) Kite

Data Server: I have developed this server to pump tick data to Ninjatrader.
It is developed using the RTD server / Client model( currently provided with NEST / NOW platfrom) . Remember the excel , in which tick data would get updated automatically ? well that was because of RTD server running with NEST. The excel was an RTD client in this case.
Also the server can scrap data from other online resources.
Note: There are some data providers that act as data servers and provide data for ninjatrader ,but at a cost.

Data Processing (NinjaTrader):
This is the software where I use the input data to do something useful. This is where all the back-testing , optimizations are done.
I chose ninja trader because its free , very light , C# based programming , A very big community using it that can help if you are stuck.
The greatest advantage of using Ninjatrader is that since it is based on C#, you can practically do anything from inside it.
You can integrate any program in it very easily.
Just to give an idea : I wanted an email sent to me each time a signal is generated... wrote a simple program in C# to send email and used it in Ninjascript( Code in Ninjatrader ).
It's not just a "charting" software, but something you can use to customize your whole trading requirements.

Exectution:
For the execution I use Kite. Kite API is an excellent initiative and looks very promising