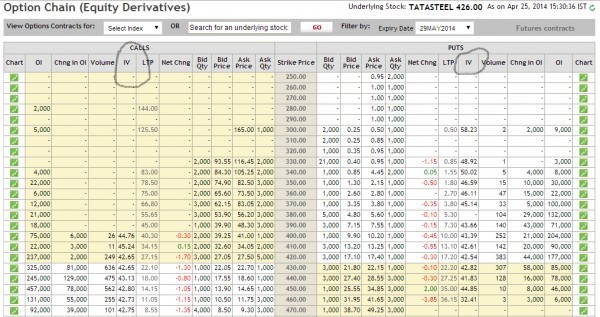
www.nseindia.com ---> Goto individual stock's option chain for IVs.
www.nseindia.com ---> Goto individual stock's option chain for IVs.
Hi,
We calculated Iv's throughout the trading day. EOD Ivs are often skewed/marked. That is why we take the average of all IVs we calculate througout the day and deliver the result as a service. Check www.sigma28.com for more info.
this is showing just IV …my question is eod data of implied volatility for charting purposes???
I don’t think anyone is extracting IVs and aggregating the data for charting purpose. Look up the option chain end of day, thats the best we have now.