bro you call this setup fine seriously? ![]()
1 Like
It’s basic price action reading.
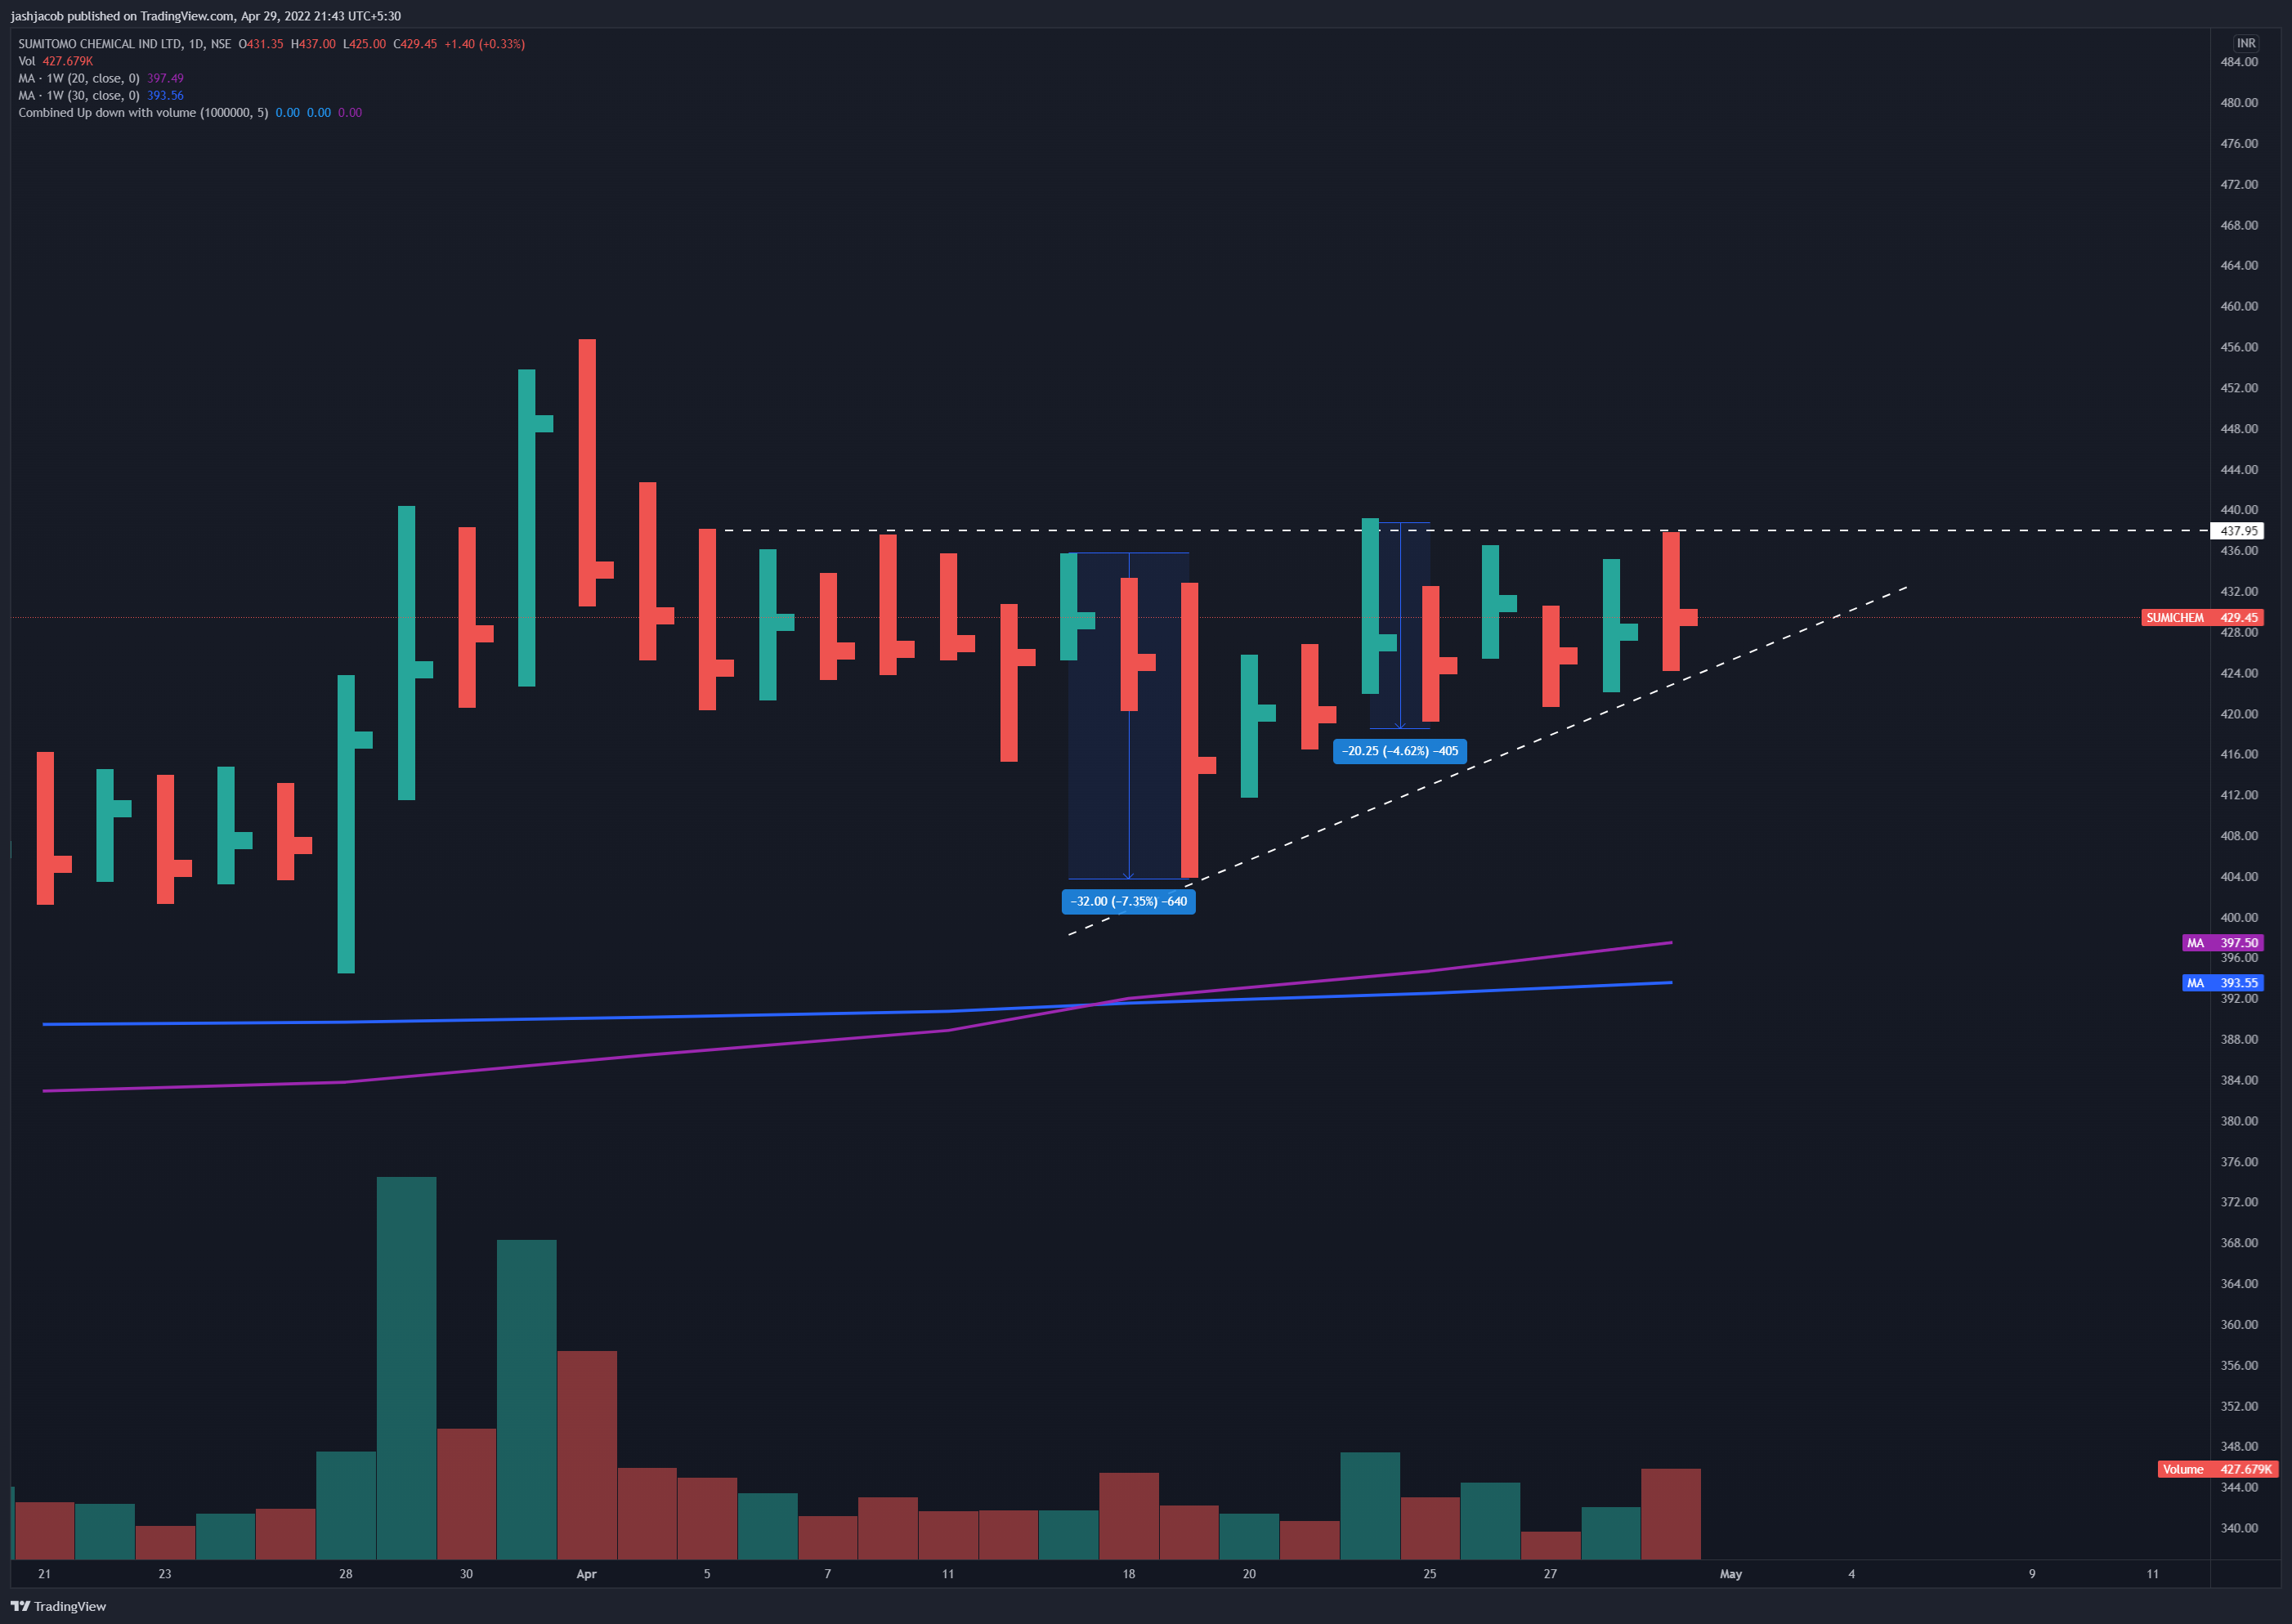
Price is wedging up with falling volumes showing that the resistance is weakening. Enter at Wedge Pop on upside.
We see a classic intraday small time frame volatilty contraction.
Something similar in a bigger day timeframe in SUMICHEM.
1 Like
can’t argue
our criteria to take trade might differ but profitability is commonality
but my way is little different
I’m okay with having less returns but I really like to see strong closing
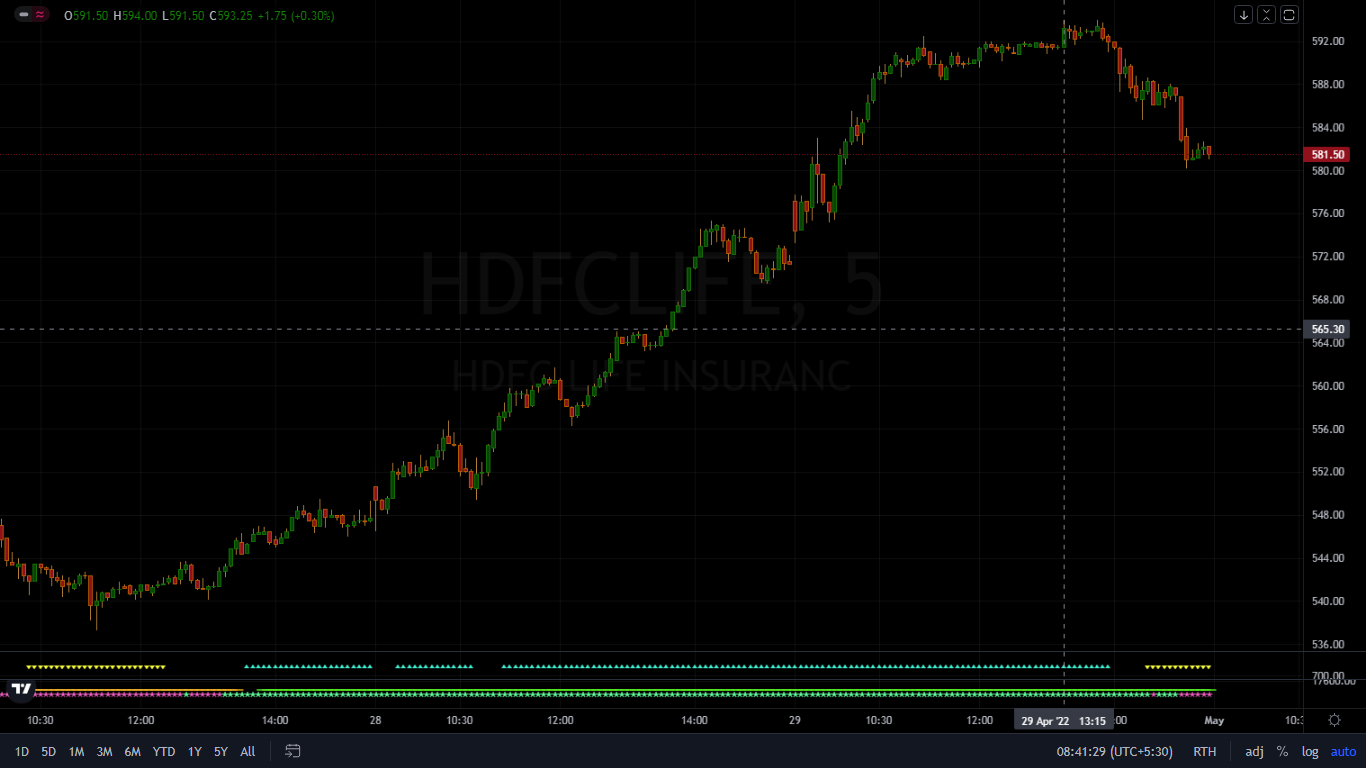
hdfc life tody could have been a good up trade at 9.30 beacuse of
- close of 3 min candle backing by good volume
- risk-reward was also favourable, nearest support being the low of first candle,
- It gapped up & sustained, itself portrays uptrend for the day
- resistance at 575 beacame support
- Scrip was already in uptrend so no reason to go short
d
1 Like
Yes, i make sure to check all my rules before any entry no matter how enticing it is. My loss on this particular trade was less than 1% of my capital (I saw those weak candles after breakout and made my exit) which got recovered and turned into profits right after this event when bulls turned into bears and sidelines also entered the bear side. Got a double pressure and recovered within 2 candles.
1 Like
everybody has diff analysis, theories & study, all works for them.
i just suggest you use another strategy/indicator to compare & improve accuracy.
5 m is very low TF, although you can succed if use indicaors more than two.
below is my setup which has shown buy signal far ago.
1 Like
I want to know about what are the indicators you are using. Can you help with that by naming them or referring to videos etc
There are 5 different types of Indicators =>
-
Trend Indicators
 Moving Avergae Convergence and Divergence [MACD]
Moving Avergaes
Supertrend
Parabolic Stop and Reverse
Directional Index [DI] -
Momentum Indicators
Relative Strength Index
Stochastic
Average Directional Index [ADX]
Commodity Channel Index -
Volume Indicators
Volume
On Balance Volume [OBV]
Force Index
Chaikin Money Flow Index [CMF] -
Volatility Indicators
Bollinger Bands
Envelopes
Average True Range [ATR]
You could search each of these names on Google
And if you have doubts on any of the above mentioned indicators you could tag me and ask them.
5 Likes
I don’t trade on indicators, not say they are junk, just that my psychology and my conscience don’t work well with indicators, i prefer the price action with volume, occasionally use RSI and stochastic (for momentum) nothing more than that.
A mentor of mine told me that - ‘If a high-odds trade can not be spotted straight off the chart, it’s just not there’
1 Like
almost all indicators works similar to each other, adding extra indicators improves accuracy. I use a combination of multi indicators & filter the disturbance with the help of pine script, as i like to see a clean chart without any disturbance. Its very irritating for me to read signal of every indicators separately.
MACD, RSI, ADX, bolliger , Elliot wave are some good indicators that help very well. you can use 2 or 3 of them to understand the signal.
I believe trading analysis should be kept simple not like any rocket science, as result are similar.
2 Likes
I agree with you, signals and indicators are not so useful in such situations. Moreover, price action is also somewhat easier.
You should be more precise in your risk management. Remember that not everything works for everyone and every time. You can either win in the trading game or lose, there’s no other way out.
Fifth one??
It is a breakout failure. You can see that there is no volume when a breakout happens and in trading, you must be aware of the volume and always follow a risk management approach.
How can you please explain , I don’t understand " Bound to fall" meaning?
bro already explained above including the criterion set to define trade
1 Like
Thank you
You must have knowledge of technical analysis. It’s a breakout failure and you must exit the trade as soon as possible.
1 Like
It’s a breakout failure. Markets are very choppy nowadays so you can find these patterns very commonly. You can also check the volume when a breakout happens.