@nithin Which is the best alternative to LTP based charts ? As a scalper, I should avoid LTP based charts, as LTP is past data. How are market depth based charts used for analyzing liquidity and buy/sell momentum?
2 Likes
Market depth can be viewed on a 20 Level II data window in Zerodha. Other brokers also provide price ladder indicating the number of buyers and sellers at each price level. Not sure if anyone provides an overlay representation directly on the candlestick chart. So far, we only have - volume profile and OI profile (on Sensibull)
In terms of liquidity - if there are high number of buy and sell orders close to the current price (narrow bid-ask spread) - then it is considered liquid. This means that large orders can be executed without significantly affecting the price and lower slippage.
Regarding momentum - let’s say there are significant sell orders above the current price, it may indicate a potential resistance level where price might struggle to rise above. On the flip side, a large number of buy orders below the current price can mean a support level, meaning that the price may not easily fall below that price. Plus, price zones where the orders are very less - could indicate less support or resistance signaling chances of rapid jumps / gaps when price reaches there.
So, the key is to monitor where the orders are clustered and watch for changes in the order book to identify real-time shifts in sentiment. A sudden increase in buy orders might indicate growing bullish momentum, while a flood of sell orders could signal selling momentum. Veteran traders call this ‘reading the tape’.
But the contrarian take here is that in current market scenario where price spikes are so common - is there an edge in reading the tape? As a scalper, unless you have an algo to do this - reading market depth will cause burnout quickly.
Does it make sense? @Athul
It will be great to know more about your style of scalping, like which instruments and timeframe you trade etc.
2 Likes
Hello Pratik,
Thanks for your insights. I am an Algo trader; I trade only FNO, trading very quick scalping, semi-automated, and automated as well.
But there are some other areas in which we need to look, and that is the most important side. “Tape reading or DOM trading” professional traders don’t look at LTP based price movements, as they are more focused on market depth.
For equity, we can consider volume to check liquidity, but for options, we can’t do that because the movement of options depends on many factors.
There are edges to analyzing market depth, but it is very difficult, and most of the time we don’t get a clear picture. Big players will spoof retailers by placing fake orders; after that, they will cancel immediately. So if we are an algo and statistical expert, we can crack market depth. In fact, 70% of trades on exchanges are automated.
As of now, I am in a learning phase, and it’s been years.
Hmm if you are looking at charts you need to use LTP-based as everything is notional, what did you have in mind.
Building something new and unconvectional, a chart based on liquidity and buy and sell pressure.
Can you be more specific, try giving an example.
I don’t know . still, I am learning.
I believe this is what @Athul may be looking at.
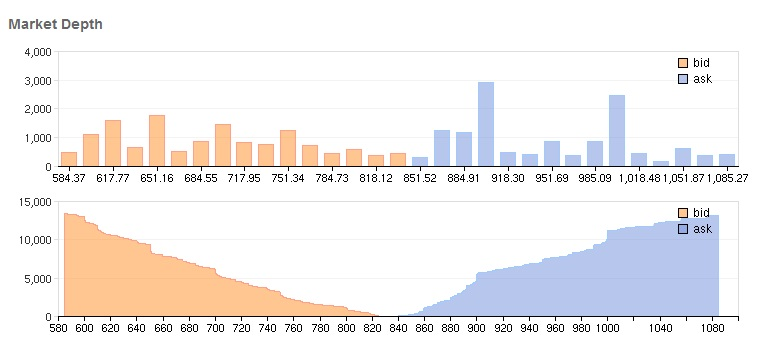
A graphical representation of the unexecuted bid and ask orders on the chart from the 20 level market depth data (similar to OI profile for open interest, Volume profile for executed orders) which shows where the maximum open orders are clustered - indicating demand / supply OR support / resistance zones.
Currently this is visible in the watchlist section for stocks.
But if the same can be made available as an overlay on the chart - it could be useful. No one provides this as of now.
2 Likes
I personally don’t see any value addition, mainly because these are just representative and at any time they can be cancelled and thus giving wrong picture, one should not use these numbers to trade but just to get an overall view.
Hey Pratik,
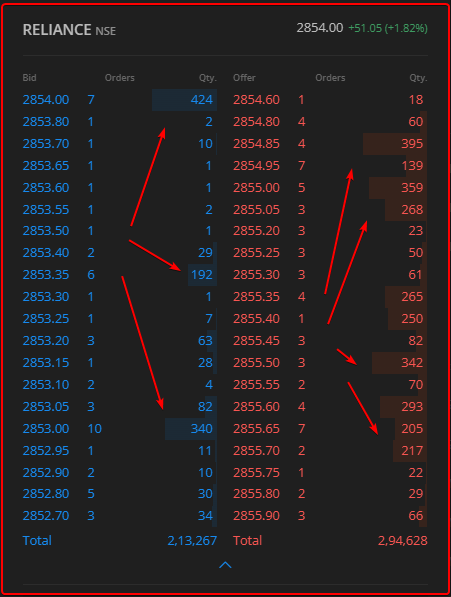
Not exactly. 20 bids/asks are currently supported for only a few stocks, and are not available for FNO. Watching 20 bids/ask depth is quite tricky compared to 5 bids/ask depth.
As I previously stated, 70% of trades on exchanges are HFT, or automated; they may be swiftly cancelled or modified to generate fake depth. Even 5 levels of depth is inaccurate therefore, we cannot rely on that logic.
As we can see, the order clusters are almost certainly fake. In reality, the majority of professional traders or major players will only place market orders rather than limit orders, which does not appear in market depth.
1 Like
@siva @nithin
Yes, it is possible, but it requires extraordinary efforts and R&D. If Zerodha can do this, it will benefit retailers.
I don’t know how it will be a beneficial thing, if it is someone could have done it already.
1 Like
Pro Algo traders use liquidity finding tools; otherwise, they can’t execute well. They use depth to find liquidity.
In fact, it will be a beneficial thing. That’s why no one will disclose it and it is not open to the public.
There are no beneficial contents available to the general public. In my experience, most charts and TA sites are useless for intraday. That’s why everyone fails their analysis.
Many use order flow analysis, market profile, volume profile ,footprint charts etc ,at least as I know. Never seen or know anyone big who use depth to place orders because depth is like illusion, I mean many fake orders can sit there.
1 Like
We can simply find liquidity by using those tools, except for depth analysis. This is possible to integrate into the Zerodha environment.