Nice …Good Info/Thank you
Hi team,
I’ve been confused with the pivot points calculation in kite. Have already read other threads asking for the same question but it still doesn’t answer the question.
Let’s take an example of Jindalstel as on 30th March 2020 where the pivot point line is placed at 82.08 but when I calculate it manually with previous day data i.e 30th march where the (high + low + close) ÷ 3 shows 81.21. Another example is the pivot of 30th Mar where the pivot line is at 90.43 but when checked manually shows 90.38. Can someone help me out with the calculation behind this. I’m using chartiq & 15 minutes chart & have also noticed it’s different from tradingview. Please provide examples for better reference.
Thanks in advance.
Also me found this issue…Pivots were showing small difference in tradingView vs Kite manual charts…
Could you recheck your calculation.
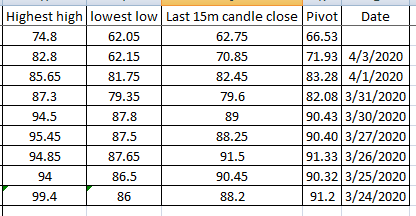
30 Mar 20 data are (87.3+79.35+79.6)/3 = 82.08 PP for 31 Mar 2020
27 data : (94.5+87.8+89)/3 = 90.43 PP for 30 Mar 2020
Thanks for the prompt response.
Can you let me know what close are you calculating?
I used to take the high, low & close of previous days candle. But assuming that you’re using the last 15 min candle close for the calculations. I’m adding high & low of previous day’s data and close of previous day’s last 15 min candle where 31st & 30 th march is proper but previous data is not matching with my calculations.
Pivot point for 27 March where (96+87.5+88.25)/3 = 90.58 but kite shows 90.40
For 26 March (94.9+87.25+91.5)/3 = 91.23 but kite shows 91.33
Thanks in advance 
Also is there any way to download the kite chart in csv with the points?
Just realised. There is a difference in prices when you use different candles. The values you got are at day candle but the values I have taken are from 15mins candles data. Ideally, this difference in data at the candle level should not happen.
Till now I was considering day’s candle but since I’m considering 15 mins candle highest high & lowest low & the last close & dividing it by 3 I’m getting it right,
Thanks a lot buddy I was not able to sleep from past 1 week because of this.
1 Like
@Parth_Bhagat Hopefully you would be able to recover your sleep today:)
There wasn’t much difference in PP values. May be at day candle level data matches with NSE and your calculation was right. Do share if you can your further progress with PP strategy.
1 Like
Sure bro🙂
Please read the conversation and you’ll get to know about the calculations and why it shows different in kite & pi. Pi uses day candle data where’s kite is Fully dependent on 15m charts. There’s a difference between day candle chart and 15min charts. This worked for me.
Happy Trading
I have been using Pivot Points on kite. Can you Help me in understanding the calculation in
TYPE : FIBONACCI.
how is that calculated ?
which are the HIgh Lows recorded ?
Why do the Pivot points calculated differently in ChartIQ and Tradingview?