
Our goal with The Daily Brief is to simplify the biggest stories in the Indian markets and help you understand what they mean. We won’t just tell you what happened, but why and how too. We do this show in both formats: video and audio. This piece curates the stories that we talk about.
You can listen to the podcast on Spotify, Apple Podcasts, or wherever you get your podcasts and watch the videos on YouTube. You can also watch The Daily Brief in Hindi.
In today’s edition of The Daily Brief:
- Decoding India’s employment puzzle
- There’s a new liquidity barometer in town
Decoding India’s employment puzzle
India’s job market presents a fascinating paradox.
Consider this: between 2017 and 2024, we added over 100 million jobs. The number of people in ‘primary employment’ jumped from 448 million to 551 million people over that period, at least as per government data. By any standard measure, adding that many jobs in less than a decade is impressive.

Yet, we remain in the grip of an employment crisis. Most Indian workers are trapped — their wages have been stagnant for many years. Adjusted for inflation, by 2011-12 prices, Indians’ hourly wages in 2023-24 were just ₹268.8, compared to ₹252.8 in 2017-18. (Side-note: This is pegged to 2011-12 prices; that is, what their wages would have been if there was no inflation after 2012. The actual average pay, from 2023-24, was ₹524.7. ) That’s a growth rate of just 1.03%. Meanwhile, most of our workforce is in insecure, poorly-paid work, with little hope of advancement.
How can both things be true? We went through two recent papers to try and break things down. The first, by Amaresh Dubey and Laveesh Bhandari (who we’ll call “Dubey and Bhandari”), looks at broad trends in India’s employment and wage data. The second, by Rosa Abraham and Surbhi Kesar (we’ll call them “Abraham and Kesar”), looks at the work trajectories of different classes of people in our labour market.
Together, they give you a surprisingly thorough frame to think about how India’s job market actually works — as two parallel worlds with almost no bridges between them.
A tale of two Indias
India’s job market runs on two parallel tracks.
The first is a world of sleek, modern, air-conditioned offices — with less than 7% of Indian workers. These are India’s formal sector employees. They have stable jobs, benefits, and regular monthly salaries. Once you’re on this track, you stay there. If someone’s a part of the formal workforce today, there’s a remarkable 83.25% chance they were a formal worker last year as well.
Getting into this world, though, is incredibly hard.
The second is vastly different. Over 93% of our workforce is in a brutal, crowded job market, with people constantly jumping in and out, cycling between self-employment, daily wage work, and being unemployed. They earn far less than formal workers — with wages ranging between ₹1,000 to ₹9,000. And more importantly, this isn’t a stepping stone to formal work. People in the informal economy tend to stick there.
How does this break down? Abraham and Kesar have some fascinating work on this — they identified seven distinct career paths Indian workers follow:
-
4.5% of all workers are trapped in a “revolving door.” They keep cycling between taking up informal work, and being outside the workforce. These are people in petty manufacturing or agriculture. Think of people that struggle to make ends meet, but occasionally find a few months of livelihood — for instance, as an agricultural tenant during the harvest season. They can’t accumulate skills, savings, or security.
-
Another 27.2% are “strugglers”. These are people who have just managed to find some informal work, but are one crisis away from joblessness.
-
A significant number — ~27% — are “job hoppers”. These keep bouncing between a series of different informal jobs. Think of someone that works as a construction worker for a few months, then an agricultural labourer, then set up a stall, and so on.
-
A fortunate few in this informal economy — 8% of our workforce — are “climbers”. These are people who manage some amount of progress in the informal economy itself. They move from daily wages to becoming labor contractors, finding some kind of stability over time.
-
The largest cohort — 38.4% — are the “steady self-employed”. These are the people who run small shops or services consistently. They needn’t be entrepreneurs in any meaningful sense, but they’ve found a more stable perch than wage labor. They earn over ₹14,000 per month — better than the average informal worker, but far below what formal employees earn.
-
All of these are people that, for better or for worse, stick in the labour force. There’s also a large group — roughly 8% — that gives up and drops out entirely. Think of women who stop working after marriage, for instance.
-
And then, finally, are the “lucky few”. This cohort — 6.7% of our workforce — are actually in stable formal employment. These are the people that have “careers” as we ordinarily understand them, and earn a fairly robust annual salary of over ₹30,000.

What is damning, according to Abraham and Kesar, is that there are vanishingly few paths between these trajectories. Those who start in informal work, in particular, almost never graduate to formal employment. While people might keep changing their source of income, most never graduate to a better quality of work.
Behind a growing workforce
Understanding these career trajectories is crucial if you really want to decode India’s employment numbers. In the aggregate, we seem to have stable, and growing, employment numbers. That almost makes us look healthy , as an economy. Zoom into the lives of individual people, however, and you see many people jump from gig to gig, with little hope of progress — like a cruel, never-ending game of musical chairs.
This is what Dubey and Bhandari find as well. On the one hand, as a whole, India’s employment numbers are growing robustly — but a lot of this is happening outside our stable, formal workforce.

Now, it’s not all bad news. Crucially, the number of people in casual labor — arguably the worst form of work -– has actually stagnated at ~109 million. People are escaping the worst jobs even if they can’t reach the best ones. Many of those people are moving to ‘self-employment’ — which increased from 164 million to 198 million workers. And the people that employ others have almost doubled over this time period.
On the surface, this looks like progress. People are escaping casual labor for self-employment.
But there’s a catch. As we’ve told you before, “self-employment” is a tricky category. Most of India’s ‘self-employed’ workers aren’t start-up founders pursuing their dreams — often, they’re street vendors, taxi drivers, plumbers, and others that run marginal operations to support themselves. They’re basically coping with the lack of better employment.
This is at the heart of the paradox we had outlined before: India is creating millions of jobs, but they’re mostly dead-end positions with no opportunities for advancement.
The great transformation that isn’t coming
There’s a way that economies are supposed to grow. According to traditional development theory, as economies grow, they should transform. They should move workers from agriculture, to industry, to services. People should go from self-employment to wage employment, and from informal to formal work.
Only, India is breaking these patterns.
Take agriculture. Instead of falling, employment there is actually growing — from 185 million to 215 million workers between 2017-18 and 2023-24. Granted, the sector is getting more complex with time. Traditional crop cultivation has stagnated at 2% growth, even as livestock farming booms at 7% and fisheries at 8.3%. Farmers are diversifying what they do. But crucially, they aren’t moving out of agriculture.
Similarly, instead of creating a steady stream of regular, non-contractual work, we have a growing number of contract workers. Between 2018 and 2024, India’s non-contractual jobs grew at just 5.1%. In contrast, our contract jobs grew at more than twice as much — at 11.6%. In just six years, the number of contract jobs in our economy has nearly doubled.
The education trap
How are you supposed to plug the gap between the formal and informal sectors? Education is supposed to be the great bridge between the two. The data shows that this works, but only partially.
On one hand, education greatly improves your job prospects. According to Dubey and Bhandari, college graduates saw 7% annual job growth — compared to 0.4% for those without education. Elite jobs like “administrators and managers” grew at 6.72% annually, while jobs in the “laborers and unskilled” category grew at just 2.06%. Education is clearly the path to a better life.

But there’s a cruel twist: education, while necessary, is not sufficient for a good life. Many college graduates still end up in the informal sector. Think of a taxi driver with an engineering degree, or a call center worker with an MBA. These are people whose education didn’t deliver the benefits it promised.
When it comes to translating education into employment, old inequalities reassert themselves. Upper castes, for instance, dominate formal employment — while SC/ST workers are overrepresented in precarious work. Your birth, in essence, determines your trajectory as much as your abilities.
The productivity puzzle
What explains our perennial difficulty in creating the kinds of jobs that matter? A big reason, arguably, is the fact that we aren’t growing our productivity .
Productivity, speaking broadly, is a measure of the workers’ efficiency — measured by how much output they can generate for each hour that they work. When countries grow in productivity, they create more with the same number of workers. As this happens, those workers command higher wages as well.
That is why it is so damning that India has seen stagnant wages over the last many years. While we’ve added 100 million jobs over six years, once you control for inflation, individual workers are barely any better off than they were half a decade ago. In essence, India is adding workers without increasing productivity — our economy is larger , but the quality of our jobs has stayed the same.
Ideally, as our economy grows, we should create many more high quality jobs, so that all the new workers we add today have a lot of room for advancement as they grow in their careers. Sadly, we aren’t doing that. As a result, many of our workers are stuck in dead-end roles.
The real challenge
All of this reveals a complicated picture of how our economy works. India manages to create employment — it has done so rapidly, in fact. But we find it hard to create work that provides economic security and advancement.
Our economy is marked by activity without advancement . Most Indians spend their entire careers choosing between different forms of insecurity. The constant churn Abraham and Kesar document — where individuals frantically move between jobs without a change in their economic fates — coexists with the aggregate growth Dubey and Bhandari measure. More people have “jobs” than before, but they’re mostly stuck in poor-quality work.
This two-track economy explains many puzzles about modern India. It’s why millions compete desperately for a handful of government jobs. Or why even parents, when looking for marriage prospects for their children, look for people with steady jobs — no matter how terrible. Or why people are happy working dead-end jobs for years, as long as they have stability. They all understand just how rare it is to find stability and security.
Until India finds a way to expand the formal economy, or dramatically improve conditions of informal employment, hundreds of millions will remain in survival mode, regardless of how many jobs we create.
There’s a new liquidity barometer in town
The Reserve Bank of India just released its monthly bulletin — and buried in there was a fascinating research paper titled “Drivers of CD Issuances: An Empirical Assessment.”
Here’s what the researchers found: “higher credit growth along with tight system liquidity encourages CD issuances, while increase in market volatility decreases CD issuances.” If you’re wondering what any of that means, you’re not alone. In fact, you’re probably scratching your head at what a CD is in the first place.
But this is a great entry point to understanding how banks find all the money that they lend, and how that might be shifting.
Let’s break it down.
What are CDs, even?
A CD is a “certificate of deposit”. The paper describes CDs as a “negotiable, unsecured money market instrument issued by banks as a promissory note against funds deposited for a maturity period up to one year. ” We know — you’re probably even more confused after that explanation. But let’s try breaking it down.
Think of CDs as IOUs that banks write when they need cash. Let’s say HDFC Bank needs ₹100 crore quickly. It might take weeks for regular depositors to walk in with enough cash. So, if they’re in a hurry, they can issue a CD — promising to pay back ₹100 crores, along with an extra ₹8 crore in interest after 6 months. Mutual funds, insurance companies, and other banks might buy these CDs. They offer interest, after all, which is better than leaving money idle.
CDs are “negotiable instruments”. That means you don’t have to hold on to them — they are tradeable. If you buy a CD and need money before it matures, you can sell it to someone else in the market. The bank can repay them instead of you.
And they’re unsecured. That is, the bank isn’t giving you any collateral for your little loan — you have to trust that they’ll pay you back.
Banks issue these to raise funds over short periods, typically anywhere from 7 days to a year. They aren’t long-term loans; they’re designed to get quick funding in a crunch.

The need for CDs is rooted in how banks work.
A bank essentially operates by taking money people put money in their accounts and lending it out. But sometimes, the number of people and businesses who want loans grows faster than people putting money in savings accounts. That’s when banks search for new ways of getting money to lend — one of which is CDs.
That’s what is happening now. The RBI notes that there’s been a "slowdown in CASA (Current Account Savings Account) deposit growth for banks as bank depositors shift to alternate assets ". Basically, as mutual funds, stocks, and other investments offer better returns, people see little point in keeping money in their regular accounts. But they still need loans for their homes, cars, and businesses.
This creates a classic liquidity squeeze for banks. Their cheapest source of funding is no longer sufficient to cover the loans they give out. And so, banks need to find alternative sources of funds. CDs seem to have become that go-to option.
The CD boom
Banks’ CD issuances hit an all-time high of ₹3.70 lakh crore in Q4 2024-25. In March 2025 alone, banks issued ₹1.17 lakh crore worth of CDs. That’s more than the entire balance sheets of banks a decade ago.
Consider this: during COVID — between April 2020 to November 2021 — the CD market had practically gone dormant. Issuances fell to as low as ₹386 crore in May 2020. Banks didn’t need CDs; they had enough and more liquidity thanks to RBI’s accommodative policies, while credit demand was muted as people pushed their expenses to less volatile times.
Fast forward to 2024: we’re seeing 300-fold increases in monthly issuances.
In fact, COVID changed the market structure itself. Traditionally, private banks were the heaviest users of the instrument. But since early 2022, public sector banks (PSBs) have become the dominant CD issuers. Their share jumped from just 6% in early 2022 to a whopping 69% by the end of 2024. Meanwhile, private banks’ share fell from 85% to 30%.

COVID didn’t just change the issuers of CDs; the investor profile for the instrument has shifted too. Mutual funds now dominate, with an ~85% share since November 2021. Earlier, CDs had a more diversified investor base, with banks (11% share), public sector banks (6% share), and corporates.
The two changes may be linked. The COVID years saw many people put their savings in the capital markets. That money was no longer available to banks to lend; while, at the same time, money market mutual funds flourished. But the dominance of mutual funds, now, means CD demand is now closely tied to broader capital market flows. If investors pull money out of debt funds, CD demand can dry up quickly.

The crux: What drives CD issuances?
That’s enough context for you to understand the main finding of the paper: "higher credit growth along with tight system liquidity encourages CD issuances, while increase in market volatility decreases CD issuances. "
What the hell does this mean? Let us explain.
Higher Credit Growth + Tight Liquidity = More CDs
The paper finds a strong correlation between what researchers call the “Incremental Credit-Deposit ratio” — the amount of new loans banks are giving out, compared to the new deposits they’re receiving — and CD issuances.
When credit grows faster than deposits, the supply of money shrinks, relative to demand. Predictably, CD issuances spike. This is textbook economics playing out in real life.
This isn’t just a matter of month-to-month fluctuations. Over the long term, banks that consistently find credit growth outpacing deposit growth become regular CD issuers.

Tight System Liquidity = Banks Scramble for Funds
On the other hand, the researchers found a strong negative correlation between banking system liquidity and CD issuances. In simple words, when money in the system reduces, CD issuances spike. This is, once again, a simple matter of supply and demand.
Every day, some banks have extra cash and lend it on the money markets. Others need cash and borrow that money. But if more banks are borrowing than lending, there’s a liquidity deficit in the system. Banks find that their short-term borrowing simply doesn’t cover their funding needs. That’s when banks turn to alternative sources like CDs.
The paper cites real life examples of this mechanism:
- The I-CRR Episode (2023): In 2023, RBI introduced a 10% incremental Cash Reserve Ratio in May 2023 to mop up excess liquidity from the ₹2000 note withdrawal. Banks suddenly found a large chunk of their funds locked up with the RBI. CD issuances immediately increased.
- Quarter-End Effects: Every March, banks see advance tax payments and GST outflows. Meanwhile, the government spends less as well, as the fiscal year comes to a close. This creates temporary but intense liquidity tightening. Predictably, banks respond by issuing more CDs.

Market Volatility = Fewer CDs
Whenever there’s volatility in a system, it seems, CD issuances fall. When the VIX index, which measures volatility, goes up, CD issuances actually decrease. The researchers found this relationship holds both in the short term and long term.
Why does this happen? The paper identifies two mechanisms:
- During uncertain times, businesses postpone investments and expansion plans. Credit demand naturally falls. If banks don’t need to lend as much, they don’t need to raise as much through CDs.
- When markets are volatile, investors run for safety. They prefer government securities over bank instruments. This makes it harder and more expensive for banks to issue CDs, so many simply postpone issuances until volatility subsides and supply falls.

Interest rate expectations
One of the most important aspects of money markets are their interest rates .
CDs primarily work on WAEIR — or the “Weighted Average Effective Interest Rate”. Broadly speaking, that’s the average rate banks pay on the CDs they issue. The paper shows that this rate jumped from around 4.2% in May 2022 to 7.5% by December 2023. In less than two years, banks had to pay almost double the interest rate to raise funds.
This wasn’t happening in isolation; the RBI was simultaneously raising its key repo rate to drain excess money out of the system. It kicked off this hiking cycle in May 2022, taking the rate from 4% to 6.5%.
In fact, when markets expect interest rates to rise, CD issuances usually tend to fall. This makes intuitive sense from both sides:
- Investors hold back: If rates are expected to rise, investors will wait to buy CDs with higher yields rather than locking into lower rates today. Why lock in 7% today when you can get 7.5% next month?
- Reduced demand hits banks: With fewer willing buyers in the market, banks find it harder to issue CDs at reasonable rates. They might simply delay issuances until market conditions improve.
The opposite happens when interest rates are expected to fall.
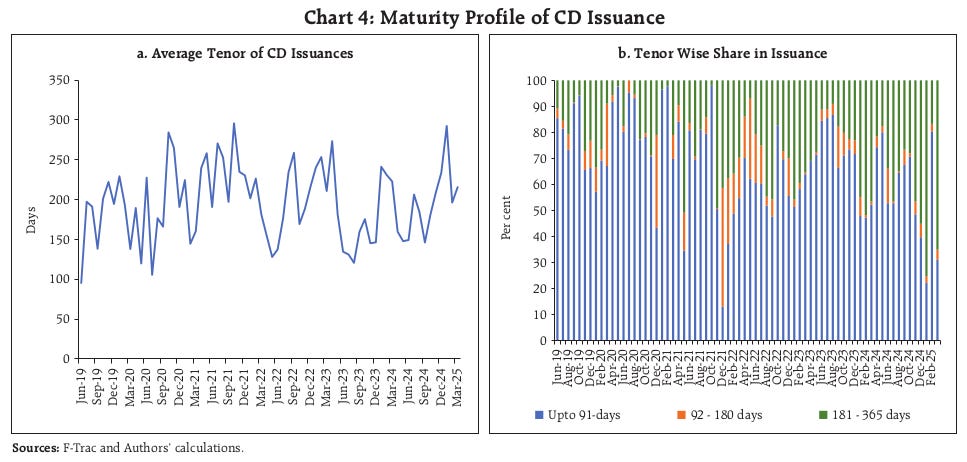
But the interest rates are just one thing. CDs also differ in how long they’re around for.
Most CDs are issued for either very short periods (up to 91 days) or longer periods (180-365 days). There’s not much in between. Banks either need money right now for immediate liquidity management, or they want to lock in funding for most of the year — rarely do they ask for funding for between 3-6 months.
During rate hiking cycles, you see long-tenor issuances, as banks try to lock in lower rates before they rise further. During rate cutting cycles, banks prefer shorter tenors, hoping to reap the benefits of lower rates soon.
The Bottom Line
Fundamentally, CDs are no longer just a niche funding tool. They’ve become a major tool in any banks’ arsenal. The next time you hear about banks issuing record amounts of CDs, you’ll know it’s not just a boring financial statistic — there’s a long story behind this, of how money is moving in the system, and how different players are adapting to those moves.
Tidbits
- Amul Tops India’s Food Brand Rankings with $4.1 Billion Valuation
Source: Business Line
Amul has retained its No. 1 spot among India’s food brands in the Brand Finance India 100 – 2025 report, recording a 24% year-on-year increase in brand value to reach $4.1 billion. The Gujarat Cooperative Milk Marketing Federation (GCMMF), which owns Amul, has also seen the brand rise to become the third strongest across all sectors in India, with a Brand Strength Index score of 91.2 out of 100 and an AAA+ rating. This milestone follows its earlier recognition as the world’s strongest food and dairy brand. The development comes as Amul expands into the North American market and strengthens its portfolio in health and protein-based products. Competing against players like Britannia, Dabur, Nandini, and Mother Dairy, Amul continues to demonstrate robust brand performance. GCMMF’s Managing Director, Jayen Mehta, acknowledged the recognition as a highlight during the International Year of Cooperatives.
- Muted Credit Growth Persists Despite RBI’s 100 bps Rate Cut
Source: Business Standard
Despite a 100 basis point cut in the repo rate between February and June 2025, Indian banks are maintaining a cautious credit growth outlook for FY26, projecting 11–13% growth, nearly identical to FY25. Deposit growth guidance remains at 9–10%, also close to last year. As of June 13, 2025, credit growth stood at 9.7%, a steep drop from 19.78% a year ago. Banks cite weak loan demand and deposit rate rigidity, especially among PSBs, where 30–40% of loans are externally benchmarked. The phased reduction in CRR, starting September, is expected to gradually release liquidity, with SBI estimating it could support 1.4–1.5% of incremental credit. However, most banks have not revised growth guidance yet and are awaiting clearer signs from the upcoming festive season. The finance ministry has urged PSBs to boost lending, but conservative sentiment around unsecured loans, NBFC exposure, and microfinance stress continues to influence decisions.
- Proxy advisory firm InGovern recommends shareholders to vote against Zee Entertainment’s
Source: Business Line
Zee Entertainment has proposed raising ₹2,237.44 crore through the issuance of 16.95 crore fully convertible warrants at ₹132 each on a preferential basis to promoter group entities. If fully subscribed and converted, the promoter group’s stake will increase from approximately 3.99% to 18.39%. The move is subject to shareholder approval at the upcoming EGM scheduled for July 10, 2025. Proxy advisory firms including InGovern and IiAS have advised shareholders to vote against the proposal, citing governance concerns and lack of clarity on fund utilization. This comes in the backdrop of Zee’s failed merger with Sony and a decline in investor sentiment. The issue price of ₹132 per warrant reflects the agreed valuation for the transaction. The proposal has sparked debate around promoter control and shareholder dilution.
- This edition of the newsletter was written by Pranav and Prerana.
 Join our book club
We’ve started a book club where we meet each week in JP Nagar, Bangalore to read and talk about books we find fascinating.
If you think you’d be serious about this and would like to join us, we’d love to have you along! Join in here.
 Have you checked out The Chatter?
Every week we listen to the big Indian earnings calls—Reliance, HDFC Bank, even the smaller logistics firms—and copy the full transcripts. Then we bin the fluff and keep only the sentences that could move a share price: a surprise price hike, a cut-back on factory spending, a warning about weak monsoon sales, a hint from management on RBI liquidity. We add a quick, one-line explainer and a timestamp so you can trace the quote back to the call. The whole thing lands in your inbox as one sharp page of facts you can read in three minutes—no 40-page decks, no jargon, just the hard stuff that matters for your trades and your macro view.
Go check out The Chatter here.
“What the hell is happening?”
We’ve been thinking a lot about how to make sense of a world that feels increasingly unhinged - where everything seems to be happening at once and our usual frameworks for understanding reality feel completely inadequate. This week, we dove deep into three massive shifts reshaping our world, using what historian Adam Tooze calls “polycrisis” thinking to connect the dots.
Frames for a Fractured Reality - We’re struggling to understand the present not from ignorance, but from poverty of frames - the mental shortcuts we use to make sense of chaos. Historian Adam Tooze’s “polycrisis” concept captures our moment of multiple interlocking crises better than traditional analytical frameworks.
The Hidden Financial System - A $113 trillion FX swap market operates off-balance-sheet, creating systemic risks regulators barely understand. Currency hedging by global insurers has fundamentally changed how financial crises spread worldwide.
AI and Human Identity - We’re facing humanity’s most profound identity crisis as AI matches our cognitive abilities. Using “disruption by default” as a frame, we assume AI reshapes everything rather than living in denial about job displacement that’s already happening.
 What the hell is happening?
Subscribe to Aftermarket Report, a newsletter where we do a quick daily wrap-up of what happened in the markets—both in India and globally.
Thank you for reading. Do share this with your friends and make them as smart as you are ![]()