The candlestick chart of NIFTYBEES in NSE is a series of long green and red candles. The bulk of the candle is formed in the first 5 min of the day. Then onwards the candles of very tiny in comparison.
The NIFYTBEES chart on BSE looks normal though.
Why is the chart so weird? Why there is such a huge difference between NSE and BSE chart?
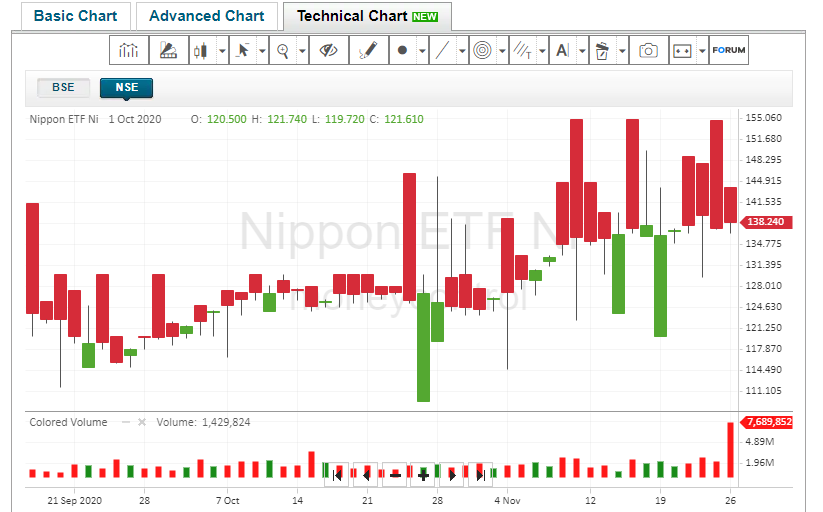
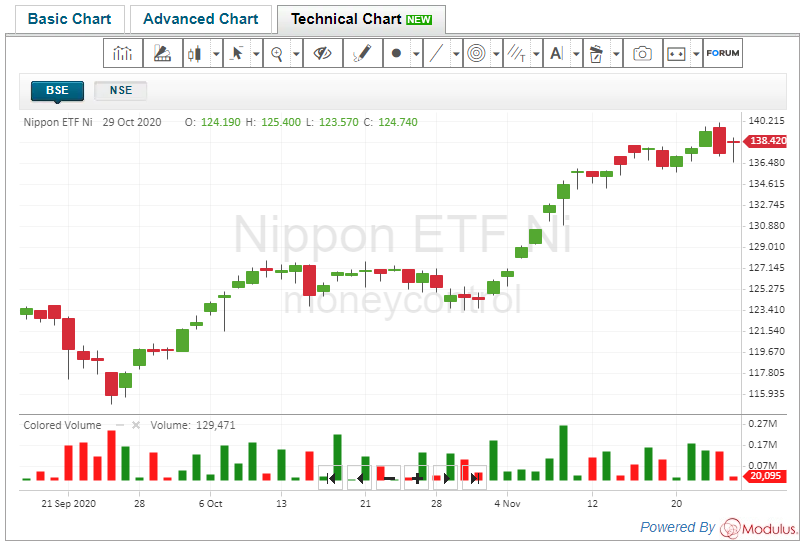
Source of charts: https://www.moneycontrol.com/india/stockpricequote/finance-investments/nipponindiaetfniftybees/charts/technical-chart-analysis/NBE01