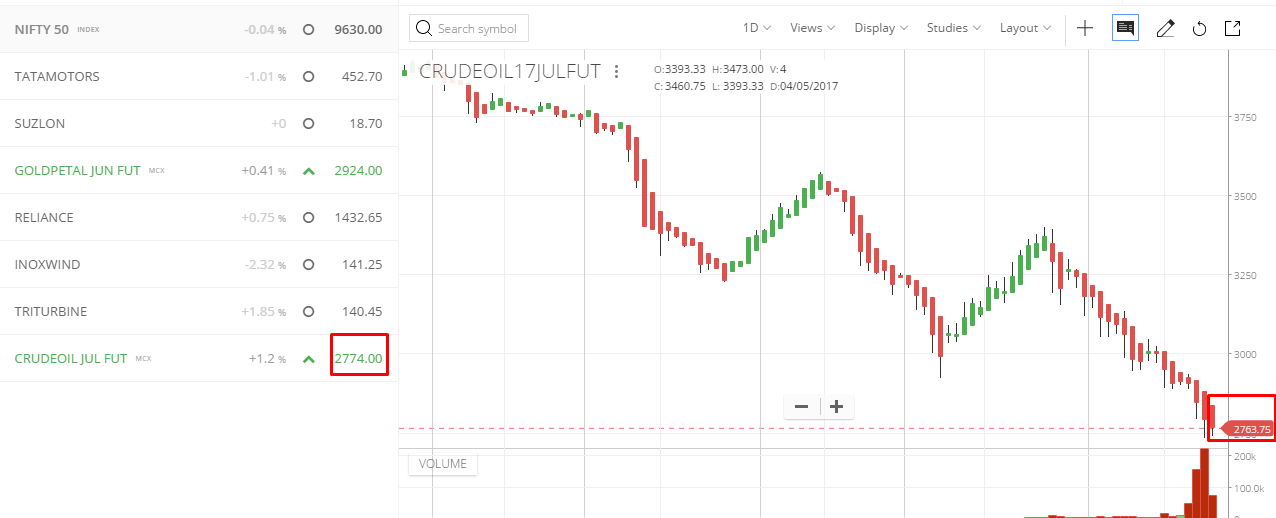
I was checking the daily chart of the Crude Oil and the LTP on the chart and the marketwatch is different,it’s the same across other timeframes too, can somebody explain.
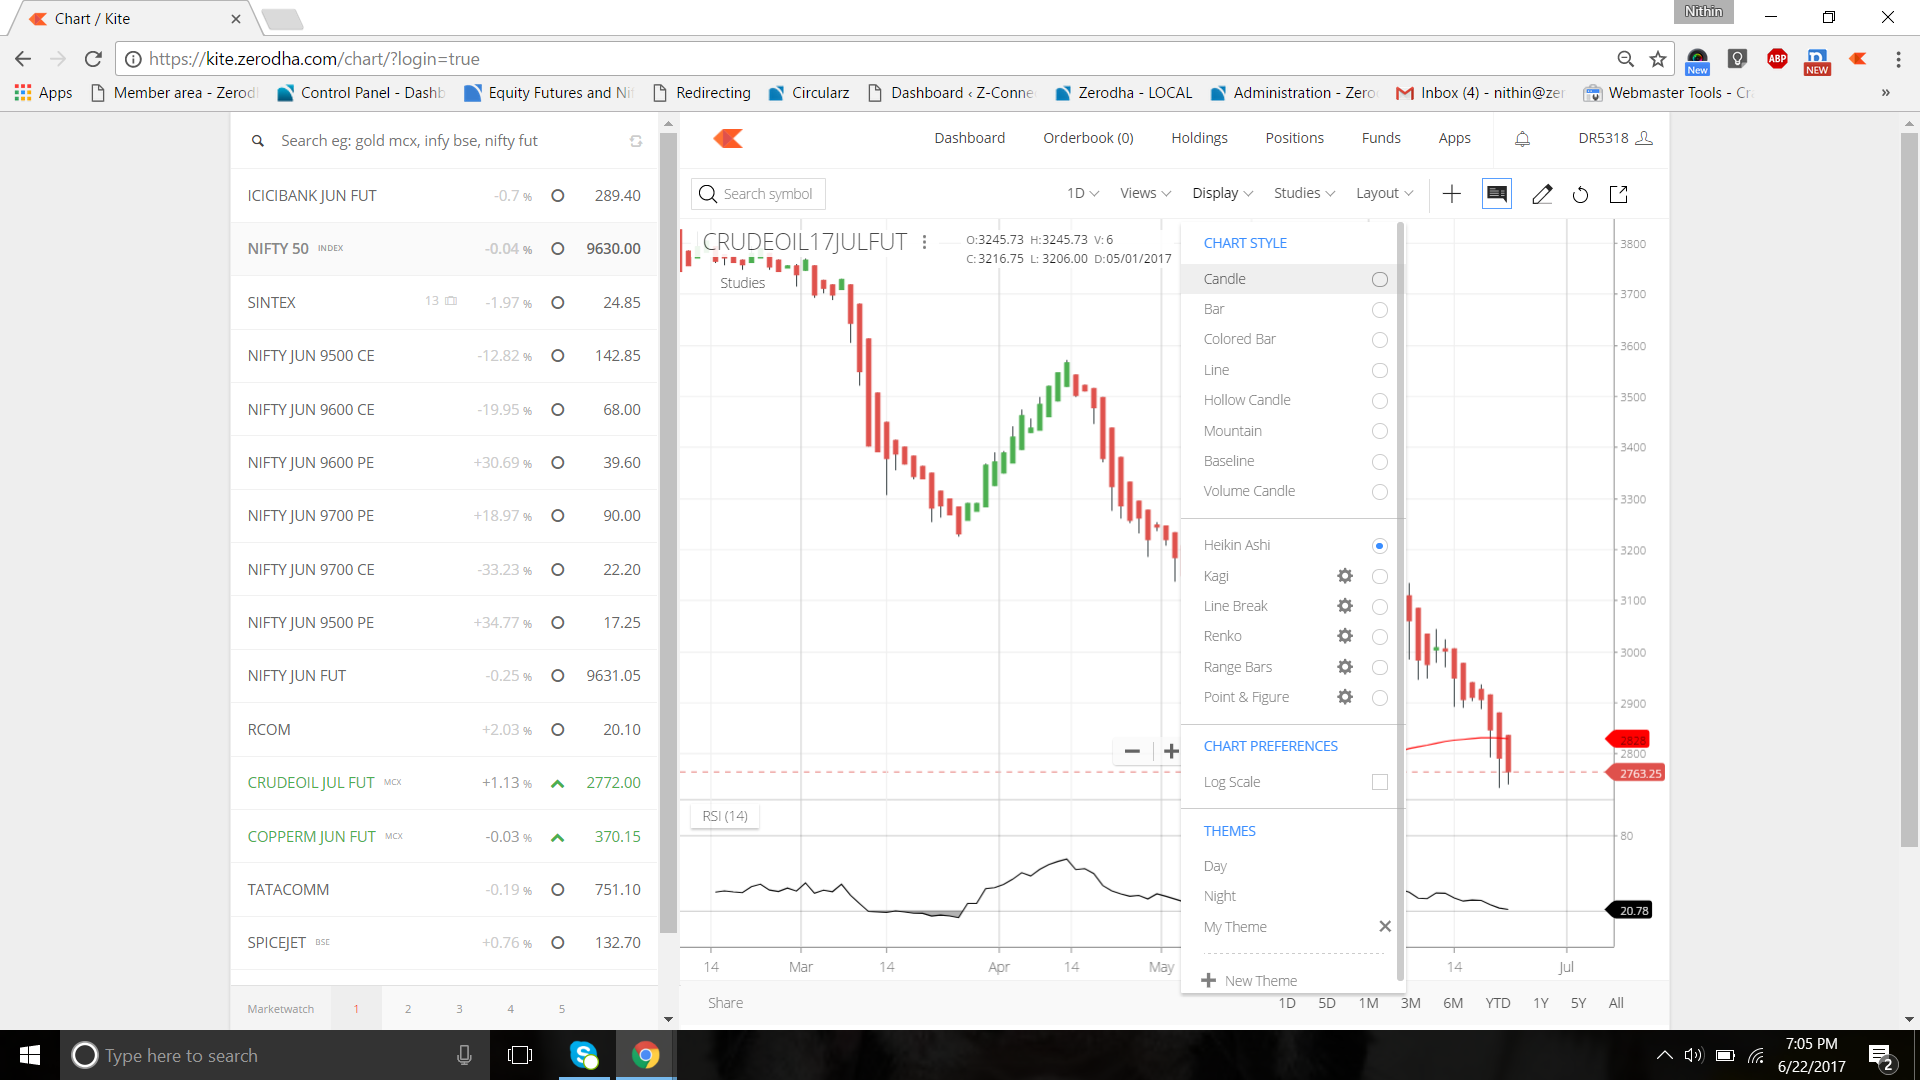
@TheDoctor looks like it is because you have opened Heiken Ashi charts. Even though they look like candle charts, they behave differently.
In a candle chart, Open, High, Low, Close is the actual OHLC for that time period. In a Heiken Ashi chart, it is calculated as below, this is done to filter out noise and to help better spot the trend.
HA-Close = (Open(0) + High(0) + Low(0) + Close(0)) / 4
HA-Open = (HA-Open(-1) + HA-Close(-1)) / 2
HA-High = Maximum of the High(0), HA-Open(0) or HA-Close(0)
HA-Low = Minimum of the Low(0), HA-Open(0) or HA-Close(0)
In a normal live candle, the close of the candle is the LTP price as per marketwatch. In Heiken Ashi, it is based on the above formula. Hence the LTP will never match with the Live HA closing price.
To switch from HA to normal candles, click on display.
2 Likes