Lately I am coming across many Corporate Action UNADJUSTED charts on Zerodha which is causing analytical errors and taking the chart reliability to a new low on Kite.
Every other platforms (Angel One, Dhan) adjusts for Corporate Actions in real-time but on Kite nobody cares for the chart experience and I feel this is a serious issue.
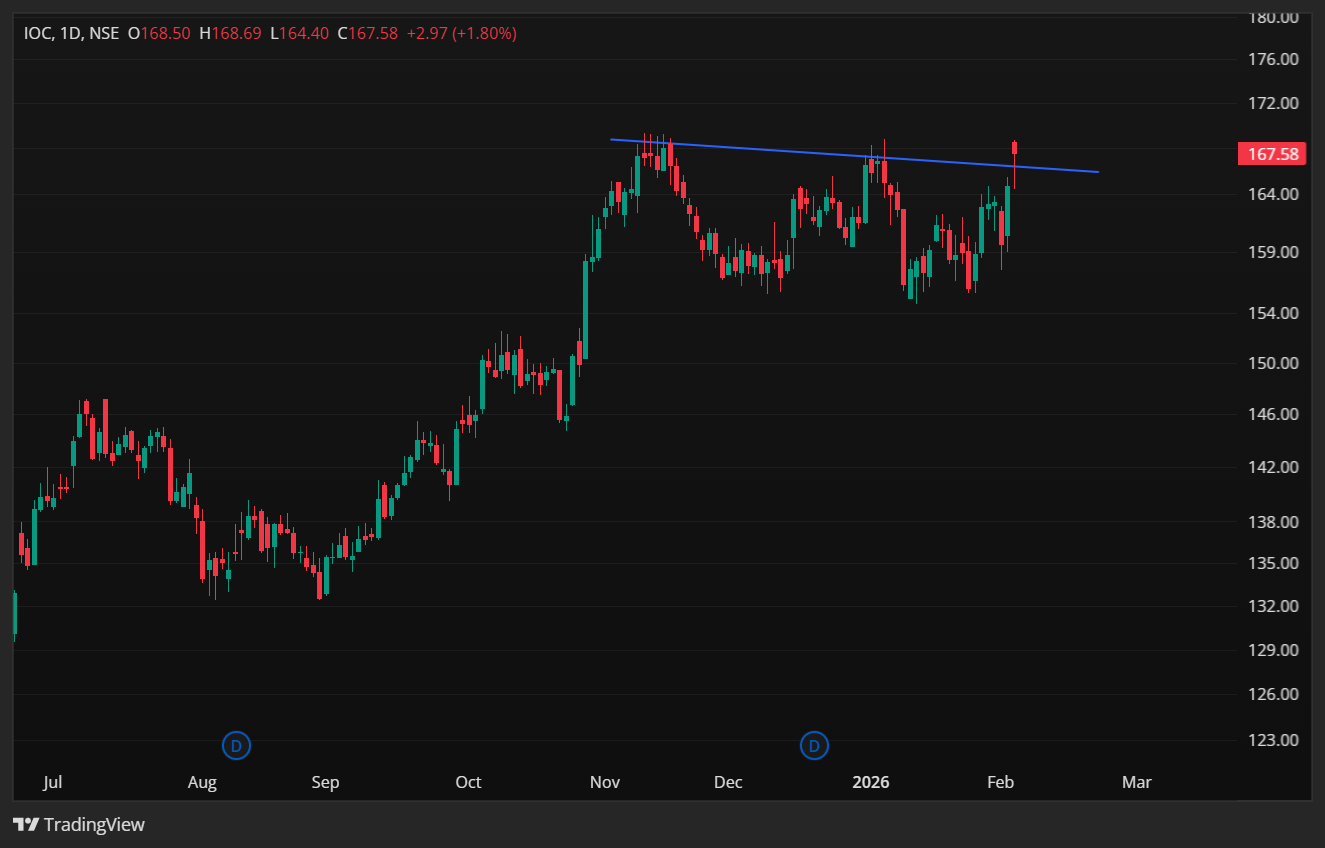
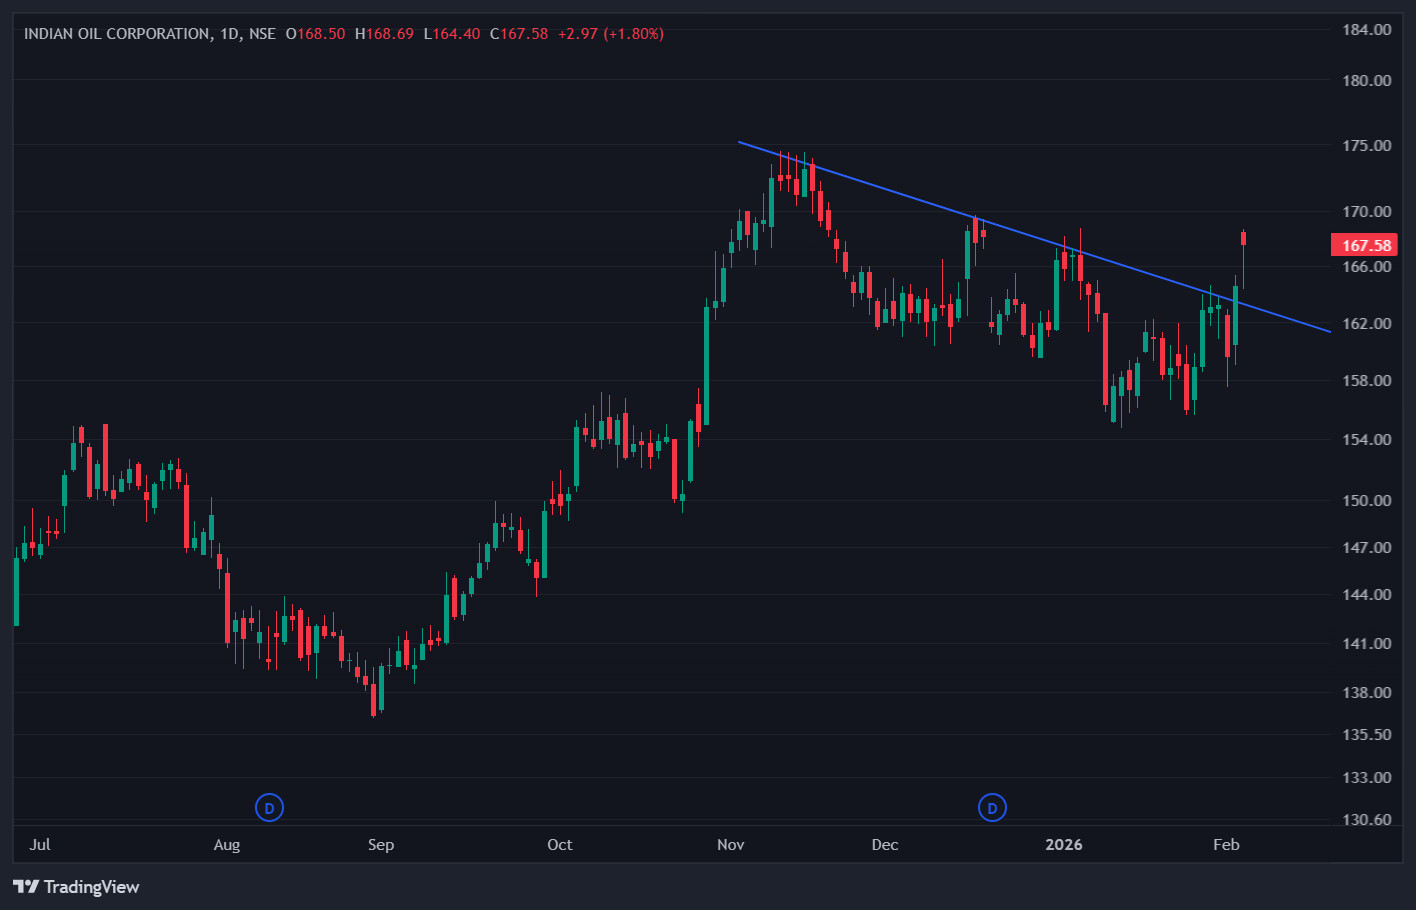
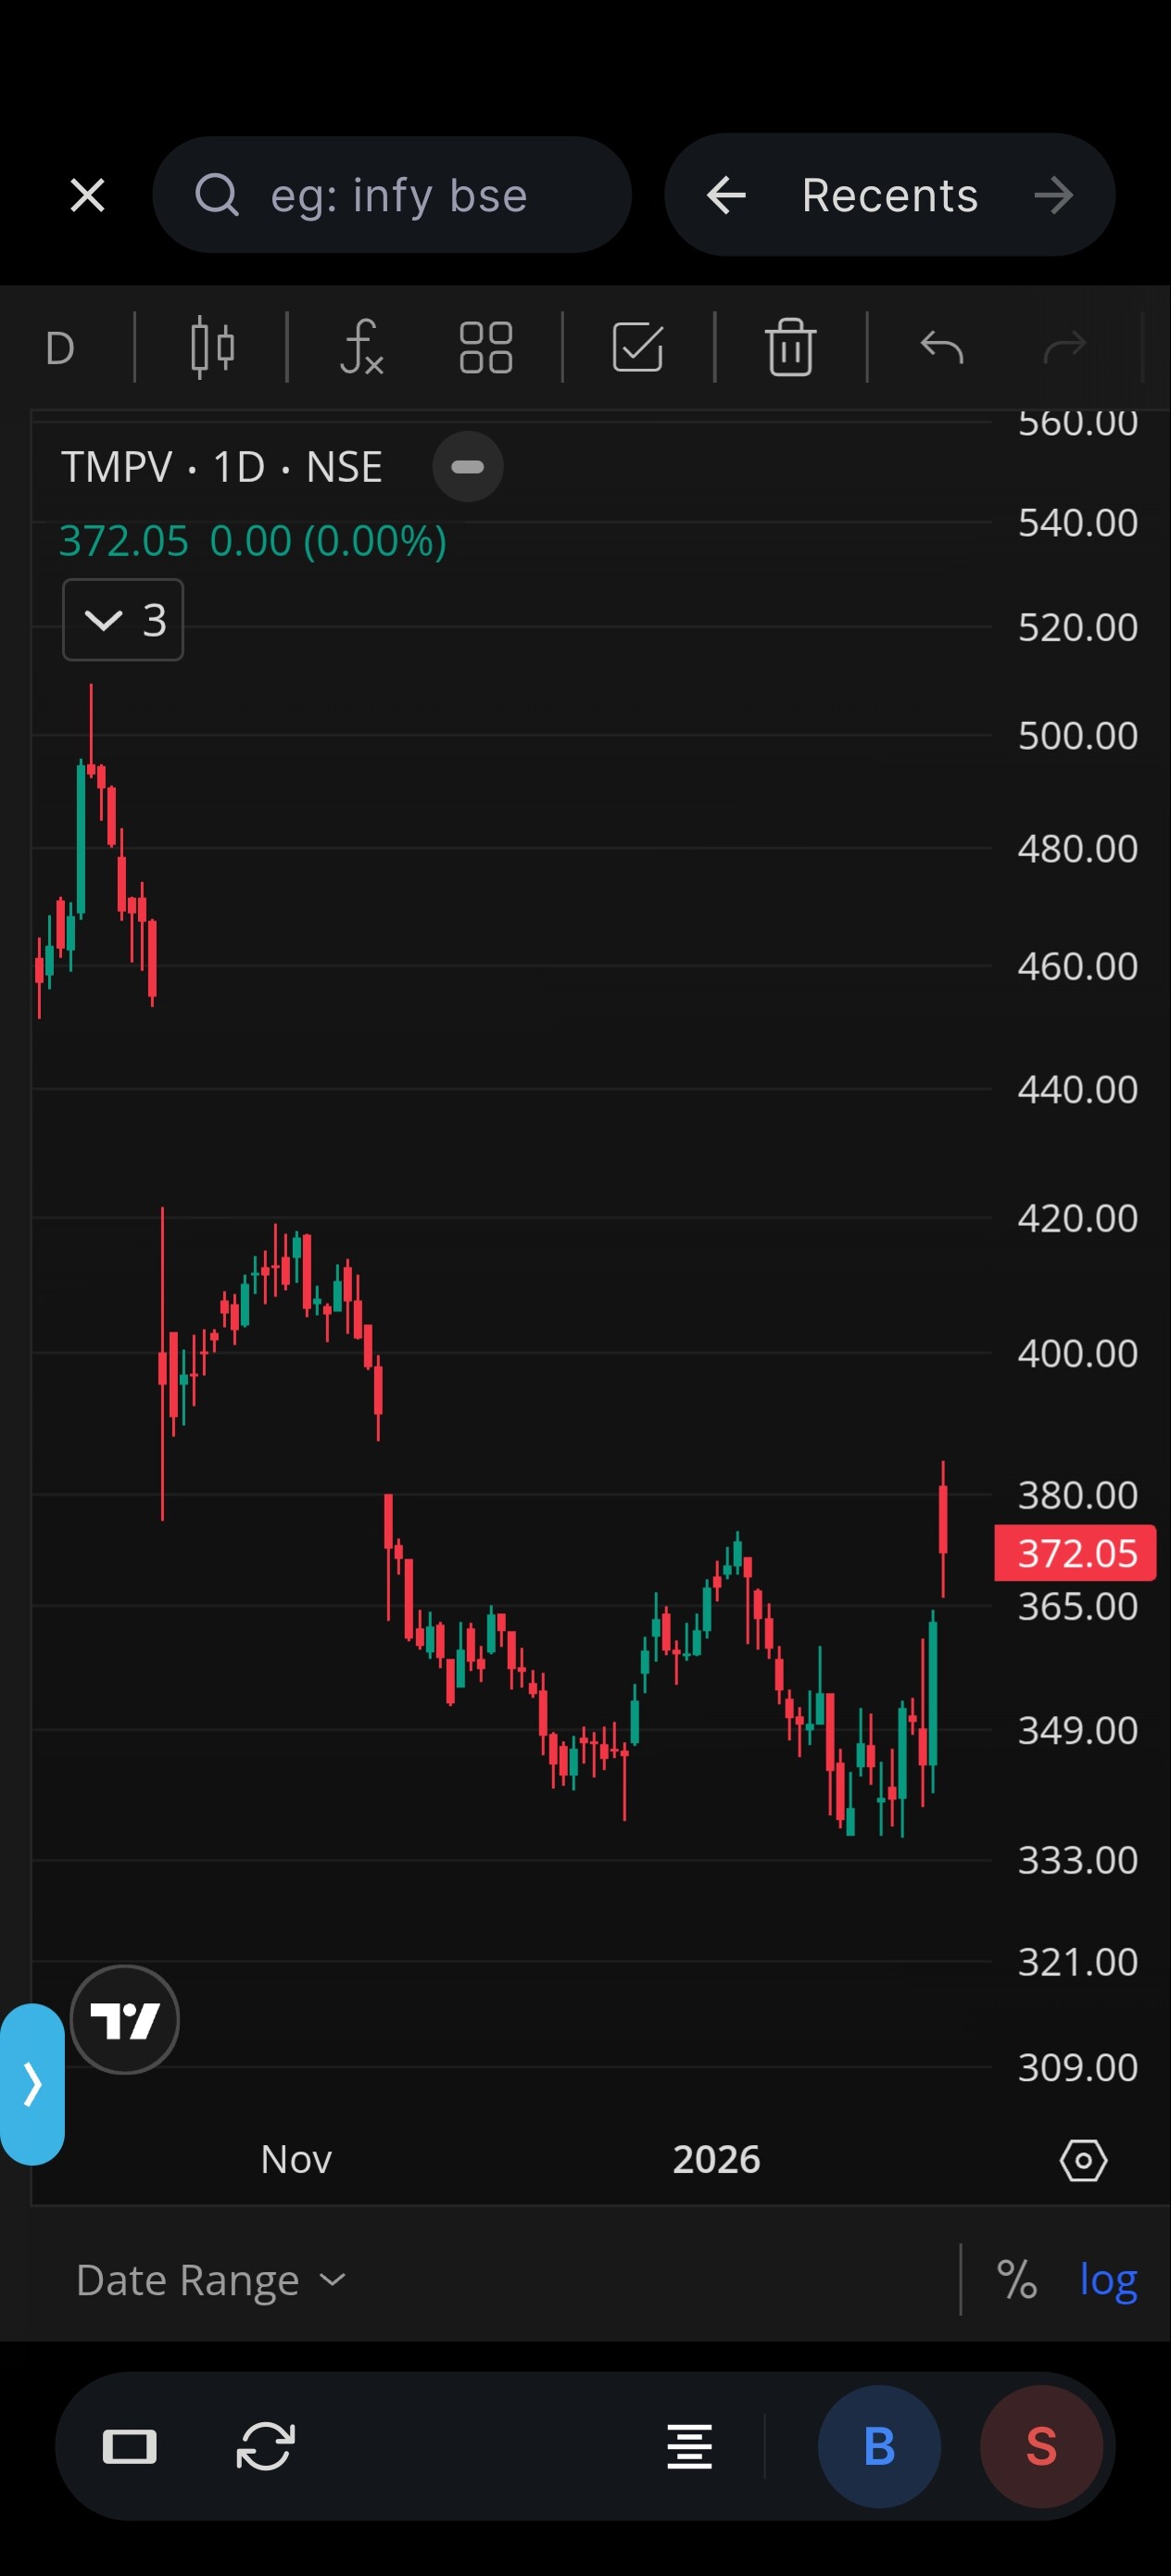
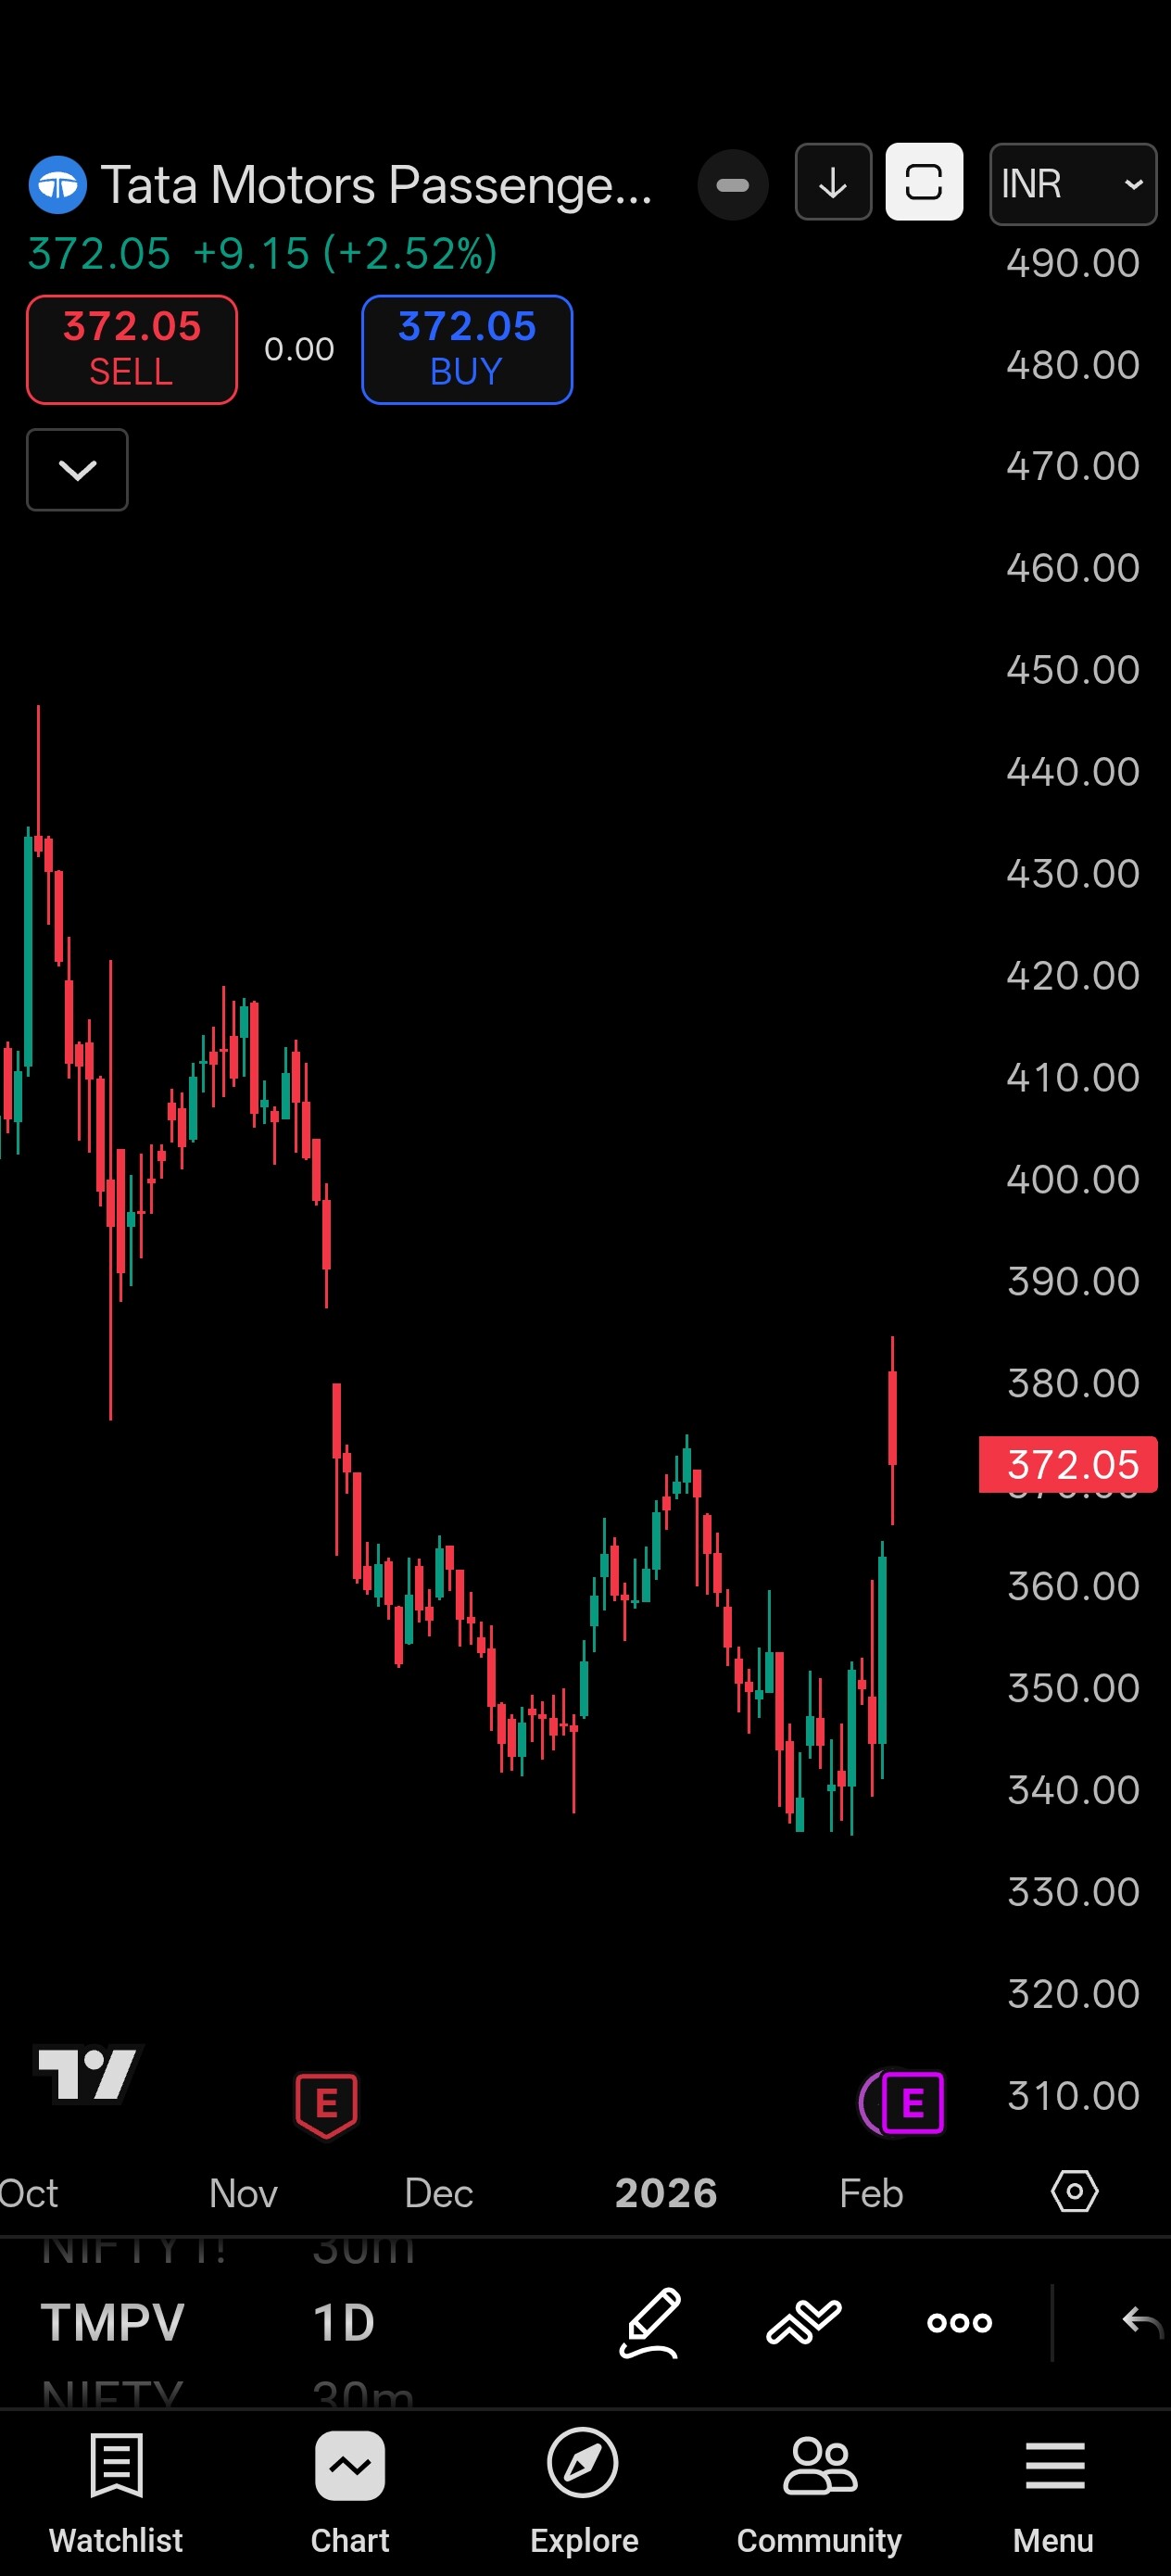
For example, TMPV stock is not adjusted for demerger in Kite, and then IOC is not adjusted for 18 Dec dividend and so forth.
Both are adjusted correctly. I am not sure how you claim it is unadjusted. For dividends, the value is subtracted from the historical data; the other screenshot you shared appears to be unadjusted data, clearly.
For spin-offs, we adjust based on the cost of acquisition, applied as soon as the COA is received. In fact, we adjust all corporate actions (bonus, split, dividend, rights issue, spin-off, reverse split) on the ex-date morning itself, so you won’t see any artificial gap-downs. This level of CA coverage is something you won’t find on most other platforms.
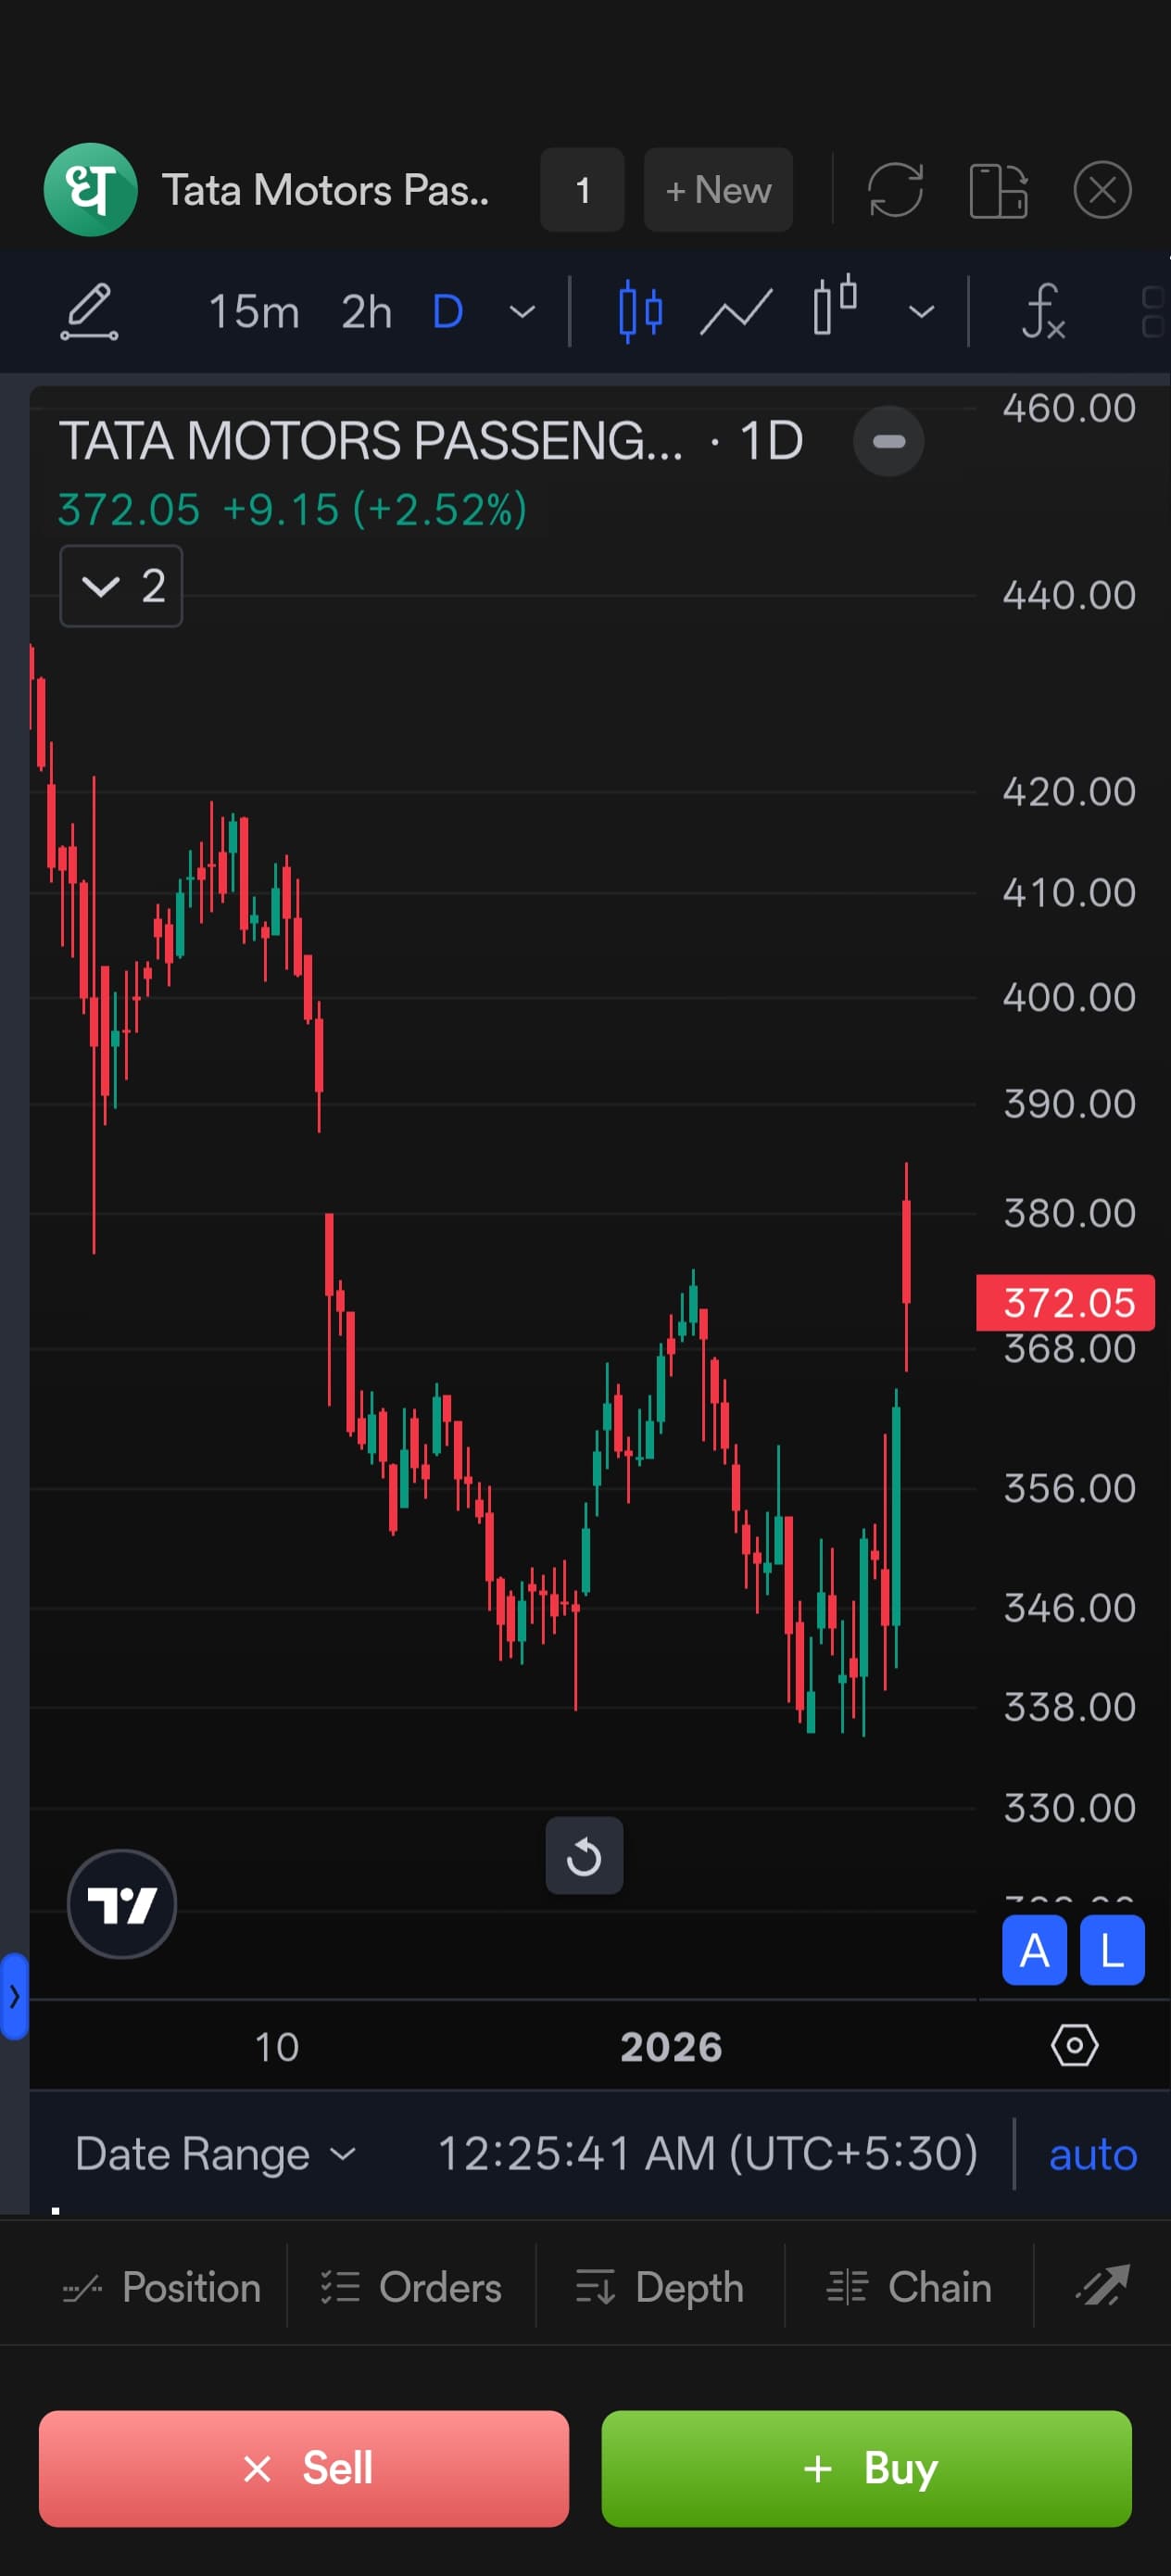
Thanks for replying. Can you please help me understand how all the other platforms including TradingView is showing unadjusted data? Can you confirm that all the other platforms are showing unadjusted data and here in the screenshot, Zerodha is the ONLY one right? TMPV 14/Oct/25 candle.