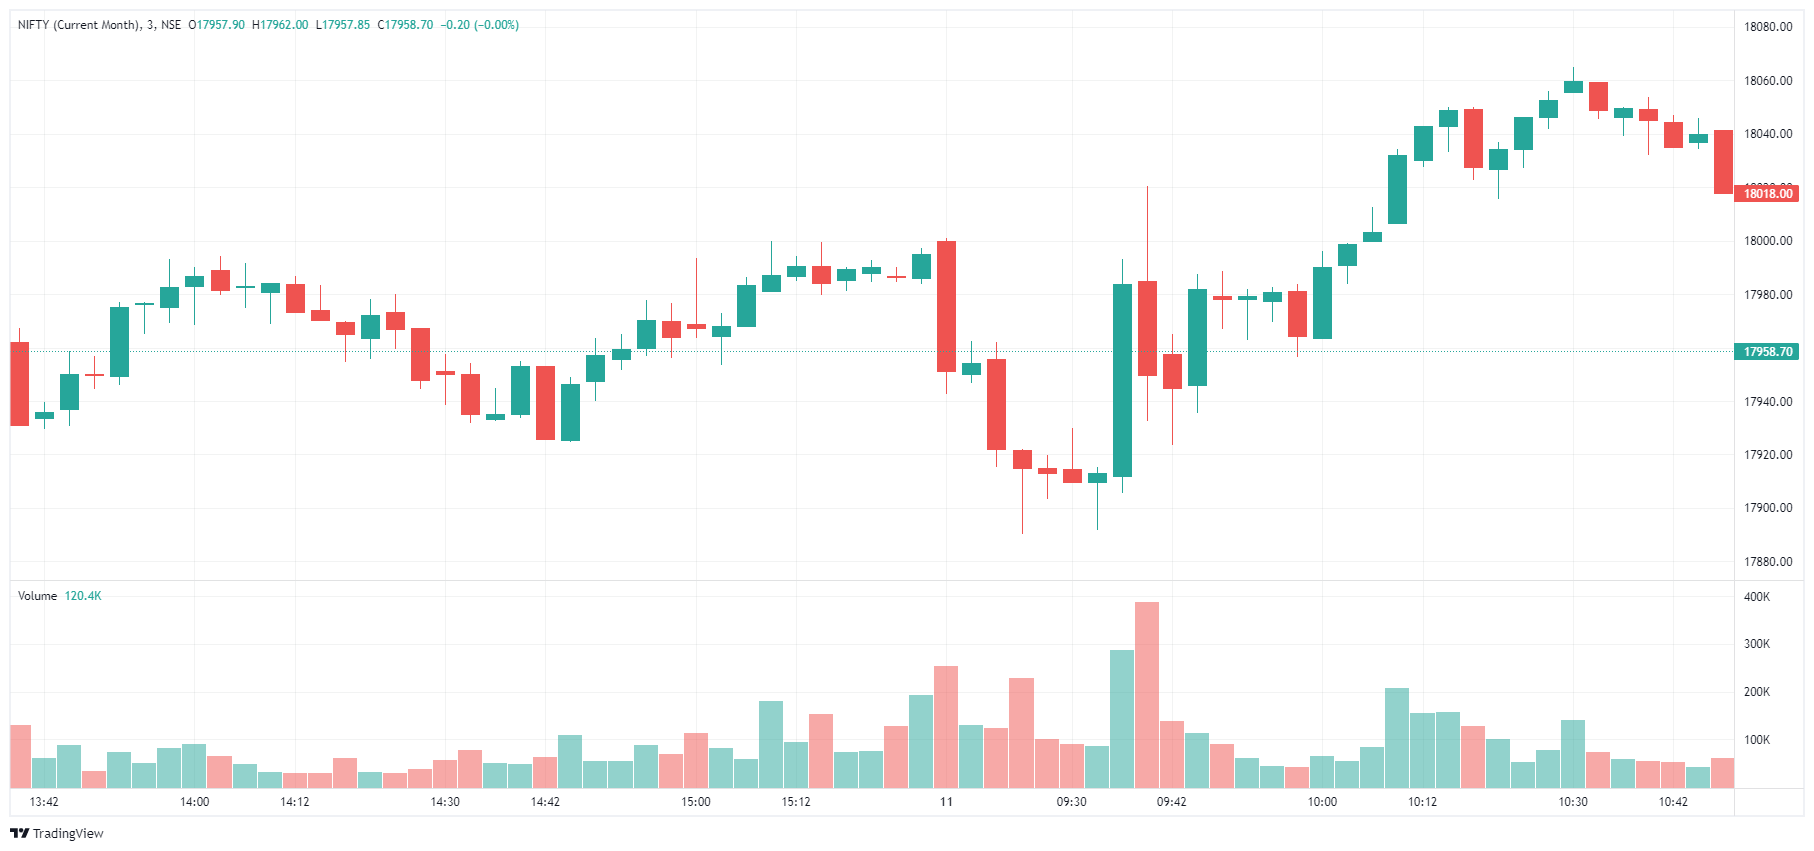
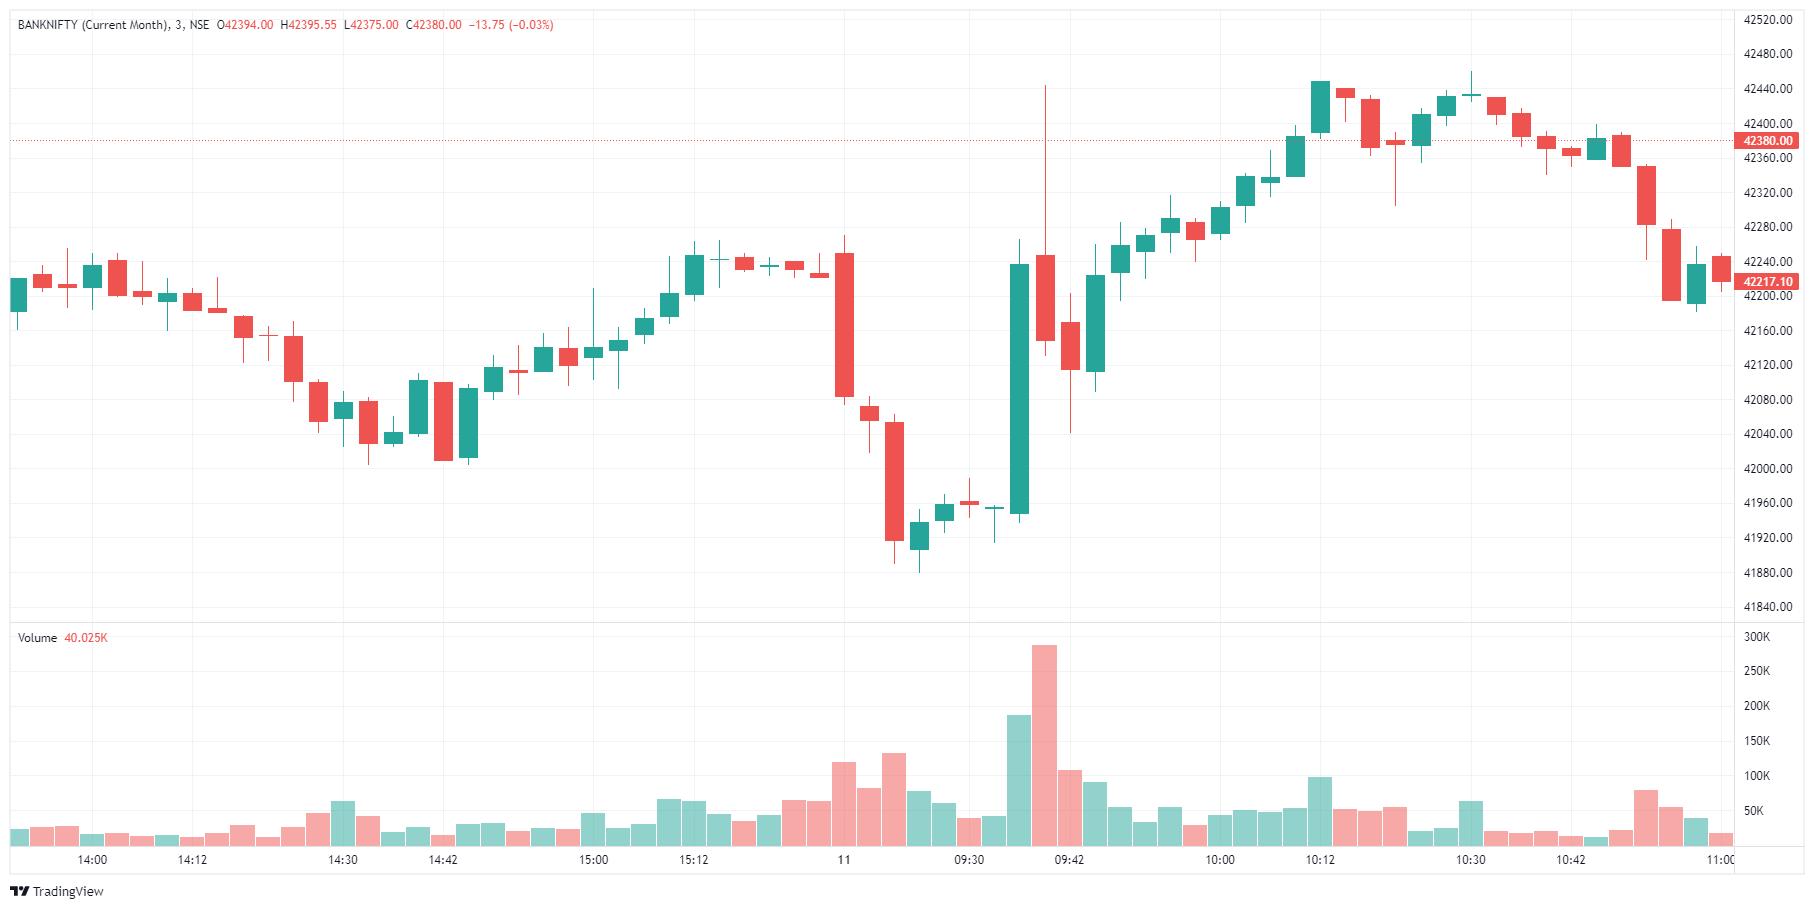
Please see today’s 3 minute charts of Nifty and Banknifty. Please see the candles in the two charts formed between 9-36 to 9-39 . Within a span of 3 minutes, Nifty moved up by 85 points and Banknifty by 285 points. Why did this happen?
3 Likes
People bought aggressively, so it moved up. This might seem like a nonsense reply, but any answer to this question is probably also nonsense, or atleast not useful.
Prices in short term move by demand and supply pressure. Demand and supply happens due to many different reasons. In my experience we cannot predict things like these with TA with absolute certainty, they just happen. maybe there was news, maybe someone hit the wrong button, maybe someone hit the wrong button and now is getting out, maybe some heavyweight stock had a large move due to whatever reason, perhaps this is short covering by BO traders who took shorts ( god help them these days…), perhaps this is profit booking from early shorts from previous days etc etc. Usually, you can come up with a reason based on how you look at the market, but i don’t think stories are useful.
2 Likes
Moreover i think, these type of candles having sudden volatility spike forms rarely and mostly during market starting and ending hours…
1 Like
May be these fast moves are made by big guys .If we see opening 3 min candle aslo moved 70 pts down , and next 3, 4 th candles also moved 60 , again 9.36 candle moved 75 pts and further canldes moved up and crossed previuos day noon swing high , all these moves may be for making lower lows and changing to higher lows and higher highs , ie these lows and highs in every timeframe change their moving average to turn around ,yesterday early morning lows get supported at friday lows , even these lows are near multiple support area in daily tf ( dec 23, 26 ) , may be consolidating for further moves , today cpi data to be released , again these are just my views , may be wrong as im in bullish bias ![]()
1 Like
To understand that see the previous candles…
Two high volume big red candles at previous day end…
These might have been due to:
- Intraday longs squaring off positions end of day
- long positions hitting g stop loss and squaring off
- scalpers/ hfts shorting on smaller timeframes to squeeze out profits
Now many of these will carry forward their position as STBT. There will be pure play STBT guys also expecting a gap down open next day
With this background think about the opening next day…
- market did not gap down
- folks who were short did not get expected move and eager to square off
- first few mins of silence to avoid opening volatility
- longs eager to jump in considering indecision candles
- then STBT guys starting to square off leading to a chain reaction of longs jumping in and stop losses hitting for open short positions…
Hence this wild move… For this reason people advise to not eagerly trade in the first 15 to 45 mins…
This is my understanding and will be happy to know more perspectives
1 Like