Every time SEBI publishes a study on F&O traders, the headline usually ends up being the same most individual traders lose money.
Today, SEBI published its latest study on Trading Behaviour of Individual Traders in the Equity Derivatives Segment for FY25–FY26, looking beyond profits and losses into how traders trade, strategy, capital, frequency, experience and persistence.
There are quite a few interesting numbers in the report.
One thing to keep in mind before looking at them: some of the strategy and capital analysis is based on a random sample of 5,050 traders. Categories such as option sellers and futures traders are much smaller within this sample, so those numbers should be read as indicative. The study also classifies traders based on their predominant behaviour, which may not capture changes in strategy during the year. SEBI also uses peak margin as a proxy for capital employed, which may not fully capture the actual capital at risk or the role of pledged securities.
Option buyers lose more often, but option sellers lose much bigger
Options continue to dominate retail trading. In FY26, around 93% of traders were classified as only option buyers, another 4% were majorly option buyers, while only around 2% were majorly option sellers.
Among only option buyers, around 90% were loss-makers. For majorly option sellers, this was much lower at around 44%.
But this doesn’t mean option selling automatically makes trading safer.
The average loss among loss-making major option sellers in FY26 was around ₹51.7 lakh. For only option buyers, the corresponding number was around ₹1.3 lakh.
So there are two very different risks here. Option buyers lost much more frequently, while option sellers lost less frequently but the losses were significantly larger when they did happen. SEBI describes this as the tail-risk asymmetry in option selling.
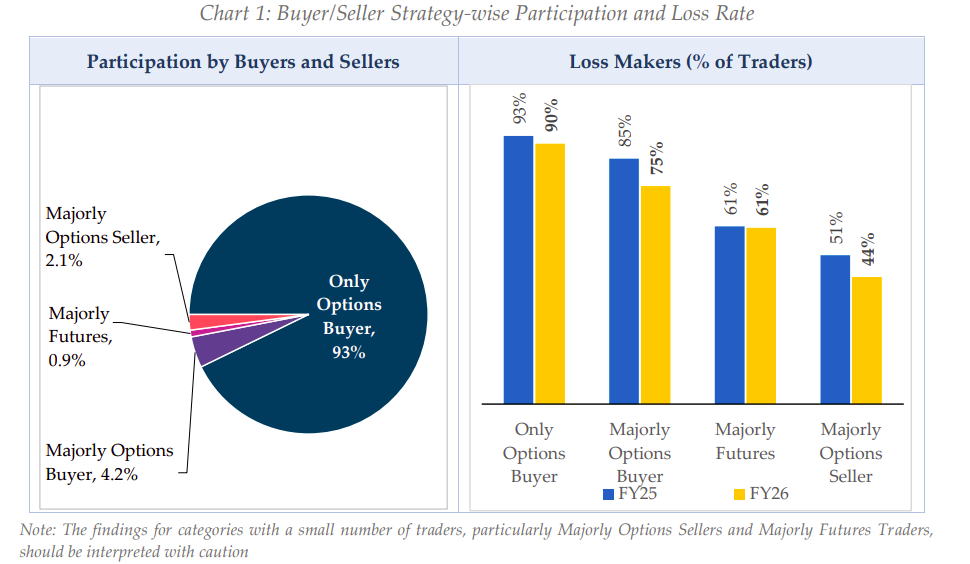
Looking only at the win rate can therefore give a very incomplete picture of the actual risk in a strategy.
More capital reduced the probability of losing, not the size of losses
Around 77% of traders used less than ₹1 lakh of peak margin during FY26, and around 90% of this group made losses.
As capital increased, the percentage of loss-makers came down. Among traders using ₹10 lakh–₹1 crore, around 67.6% were loss-makers. But when these traders lost money, the losses were much larger.
The average loss per loss-making trader increased from around ₹5,600 for traders using less than ₹10,000 to around ₹9.6 lakh for traders using ₹10 lakh–₹1 crore.
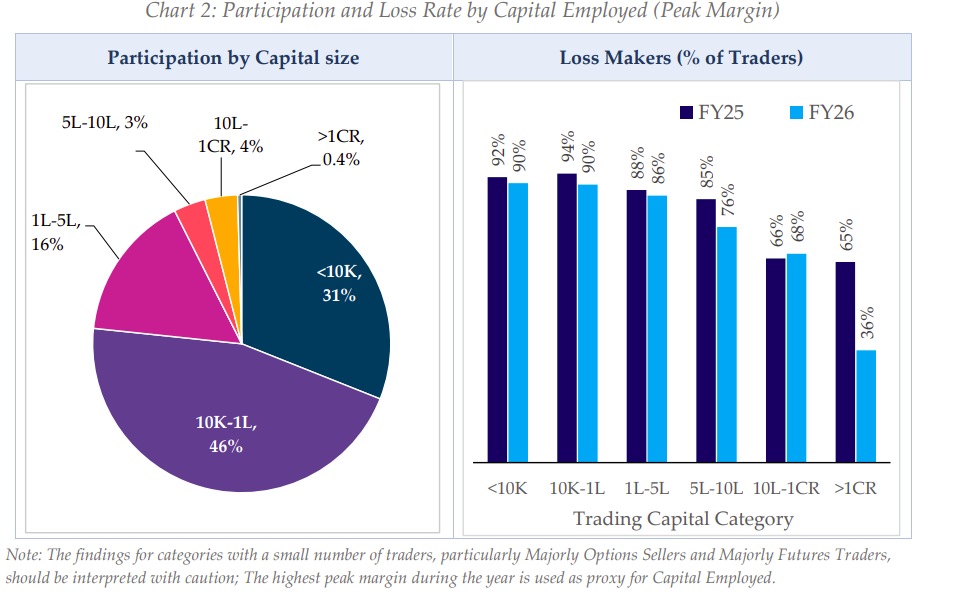
So more capital reduced the frequency of losses, but the absolute amount lost increased considerably.
Experience didn’t necessarily make traders better
This is perhaps one of the more surprising findings.
Among traders with one consecutive year of participation, around 91% were loss-makers. This increased to 94.4% after two years, 96% after three years and 96.5% after four years. Even among traders with five consecutive years of participation, around 95.3% had a cumulative loss.
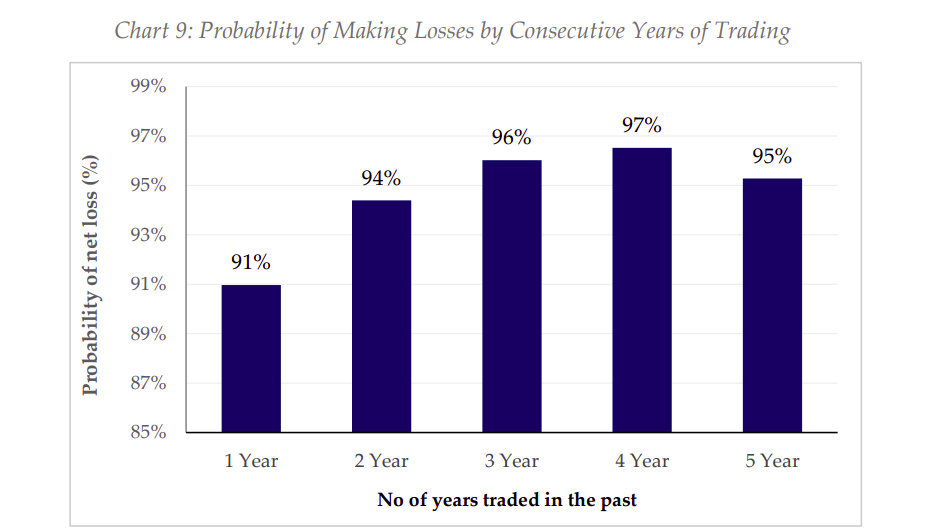
Simply spending more years in the market didn’t translate into better outcomes in this dataset.
The report also found that among traders who had incurred losses in each of the previous two years and continued trading, around 90–92% lost money again in the following year. Among traders active throughout FY22–FY26, only 0.5% were profitable in all five years, while 65.6% incurred losses in every year.
Trading more was associated with losing more
Another interesting pattern comes from the number of days traded.
Traders active for more than 100 days formed only 42% of traders, but generated 94% of the turnover and 87% of the losses.
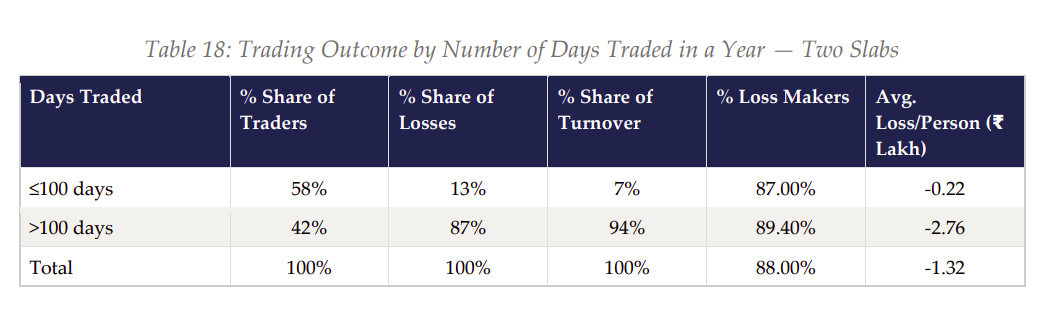
Their average loss was around ₹2.76 lakh, compared with around ₹22,000 for traders who traded for 100 days or fewer. This pattern shows up repeatedly across the study. Higher turnover, more trading days and higher turnover relative to the portfolio were all associated with poorer outcomes.
There is another number that puts this in perspective.
Across roughly 4.02 crore trader-quarter observations, only 15.4% were profitable quarters while 84.6% were loss-making quarters. The median profit in a winning quarter was ₹4,366, while the median loss in a losing quarter was ₹10,525 more than twice as much.
Among traders who experienced both winning and losing quarters, 78.7% had a higher average loss in losing quarters than their average gain in profitable quarters.
What should traders take from all this?
The report isn’t saying that one particular trading style causes losses. SEBI itself points out that these are associations observed in the data and not causal relationships.
But the broader patterns are interesting.
A high win rate doesn’t necessarily mean low risk. More capital doesn’t automatically make a strategy profitable. More years in the market don’t automatically improve outcomes, and simply trading more didn’t translate into better results for most traders in this study.
For a trader, the useful numbers to track are probably not very complicated win rate, average win versus average loss, turnover relative to capital, drawdowns, number of days traded and whether the strategy is actually improving over time.
SEBI’s study gives us the market-wide numbers. A useful exercise would be to calculate the same numbers for our own trading.
The takeaway doesn’t have to be trade less, trade more, buy options, or sell options.
It can simply be this:
Know your own numbers. If the data shows something isn’t working, change it. If it is working, understand why. That is probably where experience in markets actually starts becoming useful.
SEBI study paper: Read the full report

