I am trying to understand GSec YTM and getting conflicting results. I am hoping people here can help me understand.
Kite shows LTP for 833GS2026-GS as 102.9500 with LTT of 2026-04-13 12:42:46
I am assuming that 102.9500 is the dirty price of the bond.
TradingView shows YTM as -3.786%
My calculations show YTM as 5.0490%
Google Sheet’s YIELDMAT(“2026-04-15” , “2026-07-09” , “2012-07-09”, 102.95 , 8.33, 0) gives a result of 7.54068%
Which one of them is correct? Is there a reliable website where I can check this?
P.S. The details of the GSec is given below
Symbol: 833GS2026-GS
Face Value: 100
Issue Date: 2012-07-09
Coupon Rate: 8.33%
Last Interest Payment Date: 2026-01-09
Maturity Date: 2026-07-09
AFAIK, this is a TYPO / incorrect. The last interest payment is on maturity - 2026-07-09.
Possibly all of them, based on what each of them is calculating.
Here’s how…
The documentation of YIELDMAT() in MS-Excel and Google-Sheets,
both call-out that the function assumes that the entire interest is paid out on maturity.
Returns the annual yield of a security that pays interest at maturity.
The YIELDMAT function calculates the annual yield of a security paying interest at maturity, based on price.
Note: The MS-Excel documentation goes on to provide an example of using YIELDMAT() on a semi-annual-coupon bond, which i find contradicting.
Based on the numbers,
it appears that TradingView probably might be assuming the quoted price to be the clean-price
and adding additional accrued interest
to calculate the effective dirty-price to be paid while purchasing the bond.
AFAIK, that is not the case in this scenario,
as the quoted price is the actual dirty-price already
i.e what’s paid to purchase the bond on the secondary market like BSE.
Can you elaborate on the calculations that led you to this number?
On a somewhat related note,
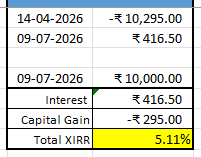
have you tried calculating XIRR() for a series of cash-flows,
to get an intuitive comparable measure of the returns from such bonds? (not just the ones maturing imminently, but also those with varying periods and coupons)
Anyways for this case, using the details/numbers from the above post, we have -
Note: Depending on the day-count convention and the compounding period convention used by the implementation of XIRR() (eg. Actual/365 vs. 30/360), XIRR and YTM may diverge ever so slightly.
Very confusing whether (and if yes, then how exactly)
the function accounts for semi-annual interest payments
if one purchases a bond in the middle of a period
Also, another thing i happened to notice
is that the values of price and rate appear to be specified out of order above. (according to Google-sheet’s documentation of its YIELDMAT() function)
The YIELDMAT formula is formatted as
=YIELDMAT(settlement, maturity, issue, rate, price, [day_count_convention]).
I used an AI agent to calculate the yield. It calculates the clean price from the dirty price and then spits out YTM value. It aligns closely with my back-of-the-envolope calculations which is good enough for my usecase.