Yes, we discussed this. This should be fixed this week or next.
We will review this again and update here.
Yes, we discussed this. This should be fixed this week or next.
We will review this again and update here.
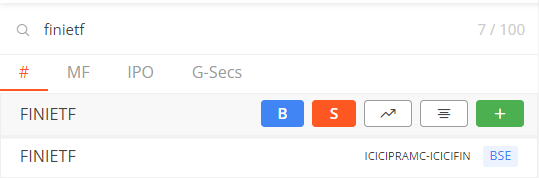
@Arockiya_Raja Can you guys add the “more” button in the search so that checking the fundamentals and stuff could be done without actually adding it to the watchlist ![]()
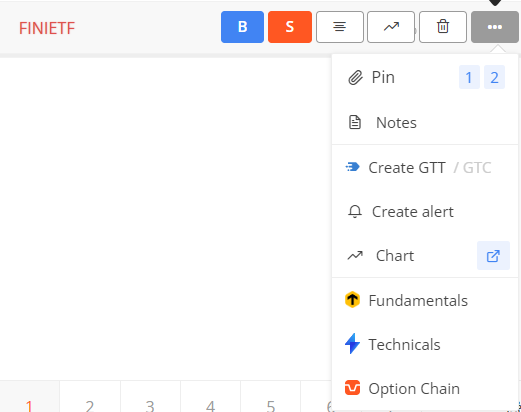
Hi @Chetan_Nahata Thank you for the feedback. Your feedback has been noted, and we will review its feasibility.
@Arockiya_Raja Today multi-charts 8 not loading with error 429.
Trying for last 20min, around 2-3 dont load.
The issue is, once a symbol doesnt load, you cant change anything and get it back. Those symbols can be replaced with something else but not the same. This disturbs the setup.
one way that sometimes works, is to change timeframe and revert it back. thats not working either.
Please DM me your ID, and I will get it checked.
The limit of 10 views / templates persists. Please make it unlimited as chartIQ. We can’t create or test new studies. @Arockiya_Raja
Being well versed for quite long, i’ve understood many things including support taking remote access.
Currently, with this specific charting issue, it was an everyday issue but after last week fix it is the first time.
So usually I do 2 things, i test in 2 different similar(good) config laptops ( win10 / win11, and latest Chrome/MS Edge)
in the different PCs, i have occasionally used in-private mode or different user profile too.
There are a couple of Z family accounts to test with( and 2 friends who also have ac’s)
Default layout is always a simple single chart. (this works well and does not disturb regular dashboard chart)
So, I pop-out chart and Load a saved Layout. Saved Layouts are multi-charts.
The 1/2/3 symbols are usually random among the 8-chart layout. All multi-chart layouts have symbols that are either current month Futures or in top-100 NSE. (all tickers are NSE)
Earlier, one way to force reload was to change TF to say 15min and revert which would then load everything. Internet is very stable.
Another way to get around is to click that symbol and change it, then new symbol works fine. But if I change it back to the original symbol that did not load, then it will just have 3 dots trying to connect.
Same multichart TV from other broker does not behave same way. Your support has seen this too.
So far, I dont seem to isolate it as system or browser or client ID specific or Exchange/certain tickers.
It appears as if server is throttling requests or its under load etc.
The default charting TF is 5min.
I would suggest your end to aggressively test multi chart loading at various times and see why error 429 comes because it is always the last 1/2/3 symbols not loading. Never a problem with layout or anything thereabouts.
So this week after “your” fix, Fri is the first time it happened in the morning so thought i’ll update here.
@Arockiya_Raja That is wonderful to hear. Is there any tentative timeline (it’s okay even if it is 50% accurate at this time, but at least there is an anchor) for this feature to be rolled out?
We offer identical storage capacities on both ChartIQ and TradingView. TradingView utilizes more memory when saving templates, which is the reason for the existing limit. Please note that increasing this limit would require a considerable amount of time.
429 error typically occurs when an excessive number of requests are sent to retrieve data. Prior to its release, we conducted extensive testing over several days. If this issue arises, it’s crucial to identify the pattern to reproduce it for an effective fix. It appears to be another issue specific to individual preferences or settings. Given that you’ve mentioned it only occurs once a week, reproducing this error might be challenging. However, we will investigate this from our end to see if we can replicate it. If you encounter this issue again, please share a screenshot and, if possible, your browser logs in DM/ticket. These could be helpful in pinpointing the problem.
TFC is expected to be ready by July or August. There may be dependencies on the charting library that could potentially affect this timeline. We appreciate your patience and assure you that we’re doing our best to deliver a high-quality, reliable product.
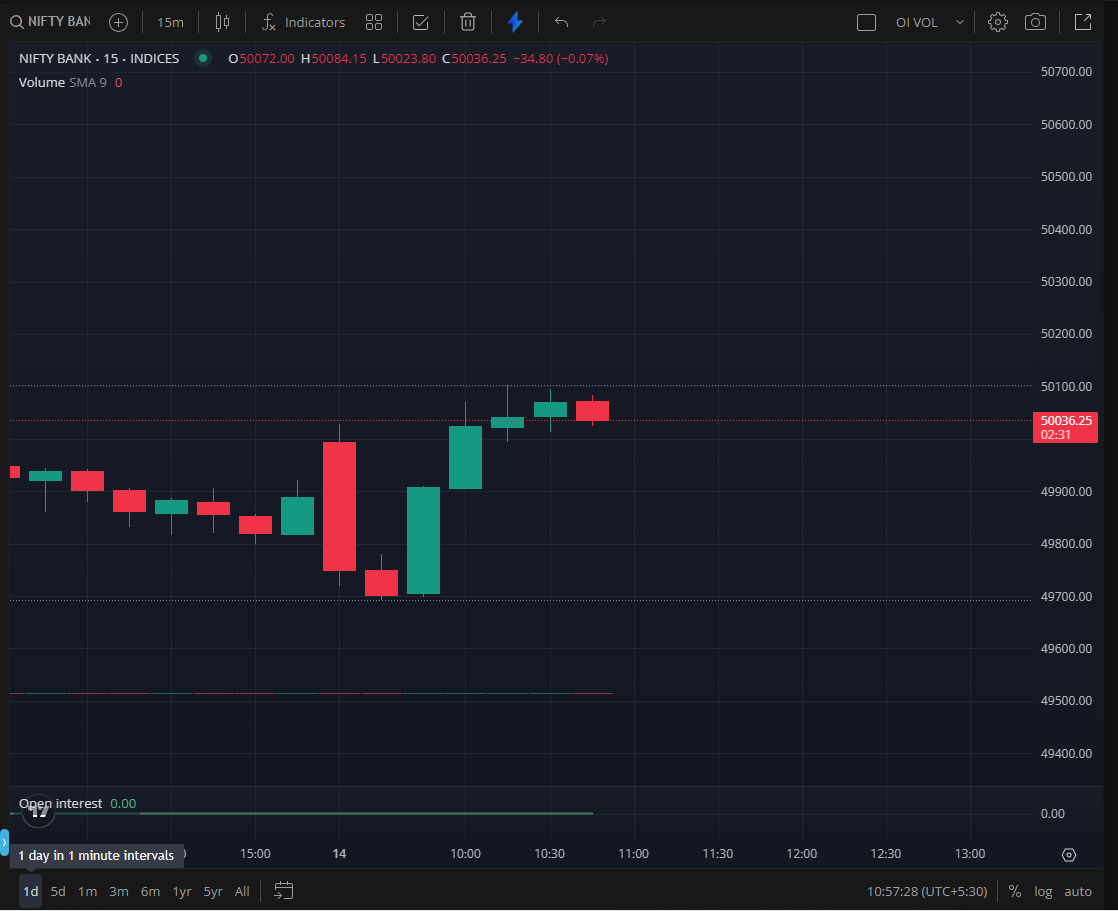
when I select 1 day time frame it is showing 1 min candle. I want to see 15 min candle in 1 day time frame.
is there any option to lock 1 day time frame ?
No, users do not have the option to change that.
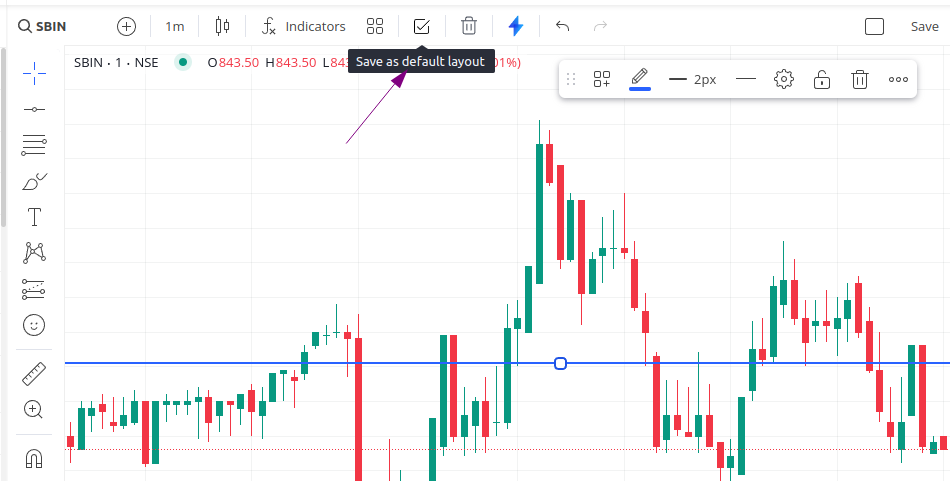
In the trading view website, if draw a pattern or shape, support and resistance on the chart it will automatically save that pattern or the shape, but in the zerodha TV chart every time we need to draw support line etc. or us there is way to save the chart. We have option save indicator template only.
After adding any drawings, click the “save as default layout” button. The applied drawing will be displayed automatically the next time.
I lost many drawings due to this issue, so I switched to a different platform for charts. Most platforms using TradingView save charts and drawings automatically, making them accessible via the mobile app as well.
@Arockiya_Raja For your 2nd point:
Once we have activated the crosshair after the long press, we can’t move the chart, it gets fixed. We have to deactivate the crosshair and then move the chart and then again we have to reactivate it. Is there a solution to that?
In the previous version, we could not use cross-hairs separately while the user checked for the OHLC; it also dragged the chart, making it difficult to move chart data to the right or left to refer to the old/new data. The TV has now resolved the issue by separating these functions. Enable the crosshair to see OHLC; disable it to move the chart.
Hi,
If possible, please provide an option to collapse/expand the watch list on the left, like how we can collapse the toolbar in trading view on the left, so that we can view the chart in full either single chart or 2 charts or 4 charts in the same window without having to pop out the chart in new widow.
OR
an option to go from full size watchlist to minimalist watchlist (Only the name of the instrument and its current price below it)
Thanks
We have already discussed these things and WIP.