We are delighted to announce a major TradingView update that will transform your experience on the TradingView chart. Packed with exciting features and enhancements that will transform the way you study and trade.
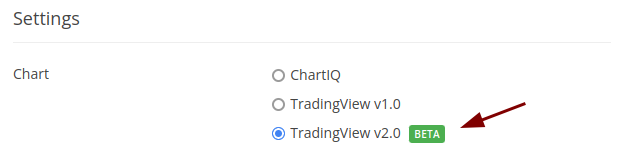
To explore the new TradingView chart version and its features, log in to your Kite (web) account and select the TradingView v2.0 option from the profile page.
Here is a list of the new features available on Kite TradingView:
1. New Indicators: Accelerator Oscillator, Average Price, Chaikin Oscillator, Correlation - Log, Guppy Multiple Moving Average, Linear Regression Slope, Majority Rule, Moving Average Adaptive, Moving Average Double, Moving Average Hamming, Moving Average Multiple, Moving Average Triple, Standard Deviation, Standard Error, 52-week High/Low, Standard Error Bands, Trend Strength Index, Typical Price, Volatility Close to Close, Volatility Index, Volatility O-H-L-C, Volatility Zero Trend Close to Close, Volume Profile Fixed Range, and Volume Profile Visible Range.
2. New Drawings: Regression Trend, Anchored VWAP, Highlighter, Circle, Path, Signpost, Price Note, Arrow Marker, Fixed Range Volume Profile, and colorful emojis and images that replace the black and white icons.
Additionally, you can now use the Weak and Strong magnet features and hide indicators.
3. New Chart Types: We have introduced new chart types, including Column, Line with Markers, Step Line, High-Low, and HLC Area.
4. Default Layout Feature: The default layout feature has been enhanced to save applied indicators, time frames, drawings, chart styles, scale settings, and more. These settings are securely saved in the cloud, ensuring synchronization across devices. Now, whenever you open the TV chart, it will automatically load your saved setup, saving time and effort in configuring it again.
Now, we have the ability to automatically save drawings and settings just like in ChartIQ. You can apply the desired settings and drawings, then either wait for 30 seconds or click the “save it as default layout” button to save them.
5. Countdown to Bar Close: This is a highly requested feature that displays the remaining time for the current price bar or candlestick to close. Knowing when the next bar will start can be crucial for timing trades, especially in scalping strategies.
6. Favorite Tools: You can now mark your favorite timeframes, drawings, indicators, chart types, and templates. This allows you to quickly switch between your preferred settings without the need for additional clicks. These favorite selections are saved in the local memory and remain visible in subsequent sessions, even after logging out.
7. Continuous Chart: We have added the continuous chart feature for futures contracts.
8. Custom Time Frames: Users now have the ability to add custom timeframes in minutes, hours, days, weeks, and months. This update provides greater flexibility in analyzing and tracking market trends.
9. Custom Range Feature: The custom range feature allows you to select a specific period for viewing price data. This is particularly useful when analyzing market behavior during specific events or timeframes of interest.
10. Price and Percentage Changes in Settings: The percentage change represents the percentage movement of the visible candles on the screen, providing you with a quick reference for price movements.
11. “Chart to Backtest” Feature: We have added the “Chart to Backtest” feature, enhancing your strategy analysis capabilities.
12. Enhancements:
-
Enhancements have been made across the platform, including changes to icons and the user interface, providing a refreshed look.
-
The periodicity sequence has been updated, and users can now view time frame details by hovering over the options.
-
To reduce clutter on the screen, the show/hide, settings, and delete buttons for indicators are now visible only when hovering over the indicator name. The darkness of the indicator pane separator has been reduced, and users can adjust its appearance through the settings. A collapse button has been added, allowing users to enable or disable the collapse function of the pane by pressing Ctrl+Double Click.
-
The compare feature now offers three different types of comparison options directly in the search results, simplifying the user experience when comparing different instruments or scrips.
-
New options have been introduced in scale properties, such as lock price to bar ratio, Invert scale, plus button, countdown to bar close, and a dropdown sidebar for labels and lines. These additions provide additional features like high and low values and average close price. When hovering over the chart, the Auto and Log Scale buttons are now displayed above the scale properties button.
-
Various indicators have received additional settings. For example, the Moving Average can now be applied to the RSI (Relative Strength Index), allowing users to customize their analysis further.
-
The multiple chart enhancement button allows users to expand a specific chart to single chart mode, providing a more immersive and focused view. The size of the specific chart can be dragged and adjusted as per the user’s custom requirement.
-
Shortcut keys have been added for commonly used drawings, including trend lines, cross lines, Fibonacci retracement, magnet, and hide all drawings. Users can now use Ctrl+Up Arrow to zoom in and Ctrl+Down Arrow to zoom out, providing a faster and more convenient way to adjust the zoom level. Shortcut keys have also been introduced for downloading and copying the image, offering quicker access to these actions.
-
The UI on the app has been enhanced to ensure comfortable interaction with the chart and access to features on mobile devices. Users can now move the chart by dragging or swiping their fingers across the screen, making it more convenient to navigate. A long press can activate crosshairs for precise analysis of specific data points. Clicking on the empty screen deactivates the crosshair, allowing users to switch between different modes of interaction easily.
-
The layout saving feature has been removed because the default layout now allows you to save drawings for multiple scripts and synchronize them across different devices.
The Trade from Chart feature has not yet been integrated into this latest update, but it will be included in the near future.
When will the update be available on the app?
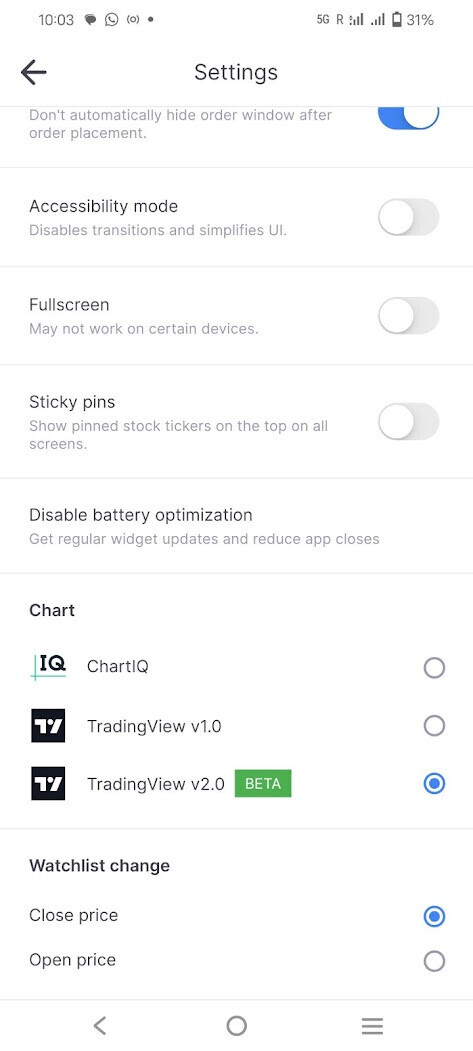
“TradingView V2.0 Beta” option is available on the Kite app as well. Make sure to update to the latest version of KIte app.
Pending issue:
The VWAP indicator is not functioning properly.
Explore the latest Kite TradingView charts and please provide us with your feedback if any.