you can use either of these
No, the fix will be released end of this week.
you can use either of these
No, the fix will be released end of this week.
Please add the Relative Strength (RS) indicator.
I found an issue in tradingveiw v2 that when we use
2 or 3 layout the moving average are showing wrong values after zooming out to more candle data on both chart then it correct values showing.
This problem with all types of moving average in any time frame
Moving average is based on mathematical calculation, so using it need back data of candle depending on preference (open,high,low,close). Simple MA is average sum of data meaning that it won’t show any incorrect representation in the chart whereas EMA depends on previous EMA data too, so any short in previous EMA data it will show incorrect representation in the chart.
Assuming that your concern is for EMA right now.
Yes exponential moving average showing the wrong values because lack of tracking back data?
These issues with tv v2 on there tv website there is no issue found like this !
Do you still experience sluggishness a few hours after the market has opened?
Most of the Days it’s still sluggish after 1-2 hours, if you try to scroll through the chart or change timeframe and then try to reorganize or move left or right it’s very slow, even if you try to move the order window it’s very slow. I have tried most of the things in chrome, enabling/disabling memory saver, hardware acceleratoin but to no use. Tried one program called RAMMap to clear the standby memory but still the issue is still there…
Lately trading is a bit rough so not placing more than a couple of orders ![]() but I can defenitely say that the problem is from your side because while watching the snapquote window I can say that most of the times there’s a few seconds delay while reflecting the actual orderflow, I have checked this by placing a large order a few ticks away and while it was almost instantaneous earlier, now sometimes it’s generally a few seconds late. There’s a lag because earlier I used to punch over 30-40-50 orders in a day and it was like you get what you see (chart and prices in the snapquote tally exactly)… lately it’s more like you have to double check the chart and snapquote to see if both tally and then place the order. Also earlier I used to trade by mobile interenet by tethering and since past one year using broadband connecting.
but I can defenitely say that the problem is from your side because while watching the snapquote window I can say that most of the times there’s a few seconds delay while reflecting the actual orderflow, I have checked this by placing a large order a few ticks away and while it was almost instantaneous earlier, now sometimes it’s generally a few seconds late. There’s a lag because earlier I used to punch over 30-40-50 orders in a day and it was like you get what you see (chart and prices in the snapquote tally exactly)… lately it’s more like you have to double check the chart and snapquote to see if both tally and then place the order. Also earlier I used to trade by mobile interenet by tethering and since past one year using broadband connecting.
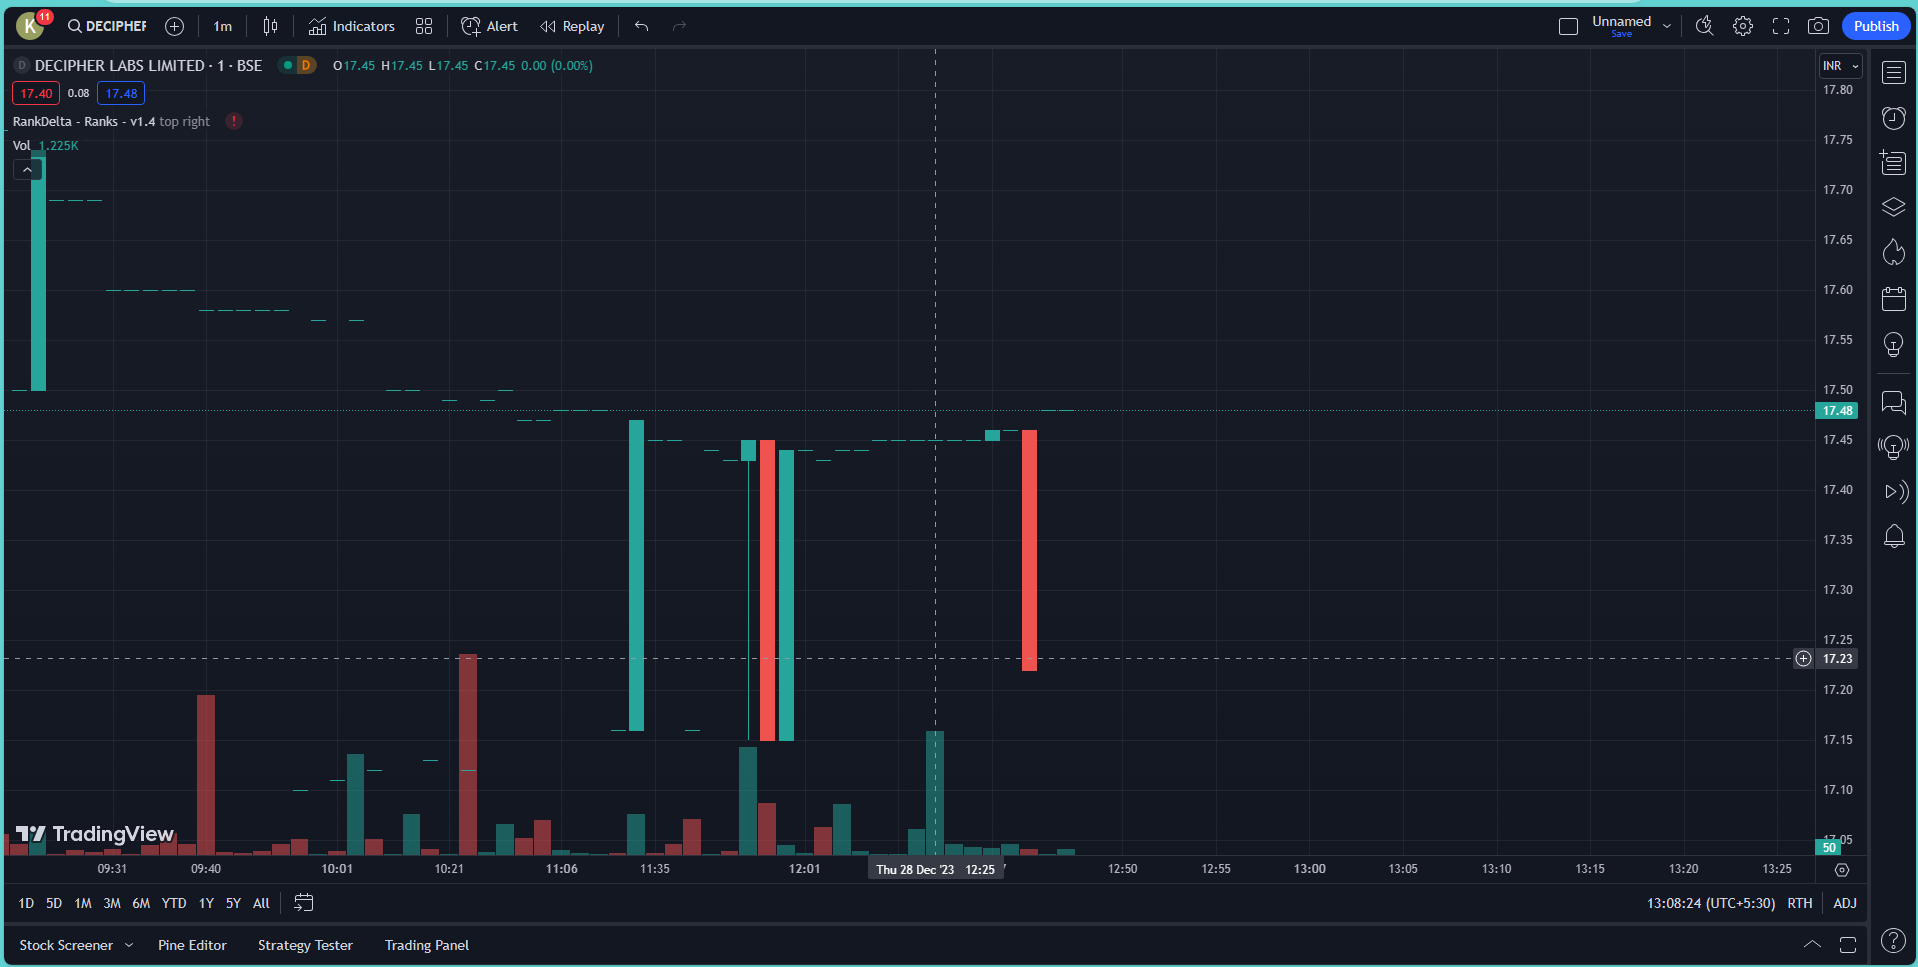
@Arockiya_Raja Just to prove my point I bought 1000 +225 shares of this pathetic low volume stock at 12:25 and it’s not reflecting in the chart. TV charts are 15min delayed so had to wait 15 minutes to take the screenshot. Also I have closed and opened the Zerodha chart multiple times but it’s still not showing the correct traded quantity (what I bought 1.225k shares) in the chart. Also if you compare the volume of both charts you would see zerodha not showing correct volume in most of the places while TV does.
I would have to close this trade in 500-1000rs loss but I hope you get the point. I get that the live snapquote or chart may miss some of the trades but after refreshing/closing and opening the chart at least the past 1min candles should show the correct volume. It was not the case earlier but sadly now it is…
This issue isn’t connected to the TradingView update in any way. The same values can be observed on ChartIQ as well. I’ll look into this to ascertain if any modifications are needed
Furthermore, this concern isn’t associated with the TradingView update either. We need to delve into more details to provide effective assistance on this matter. Could you share your client ID via DM to facilitate further support?
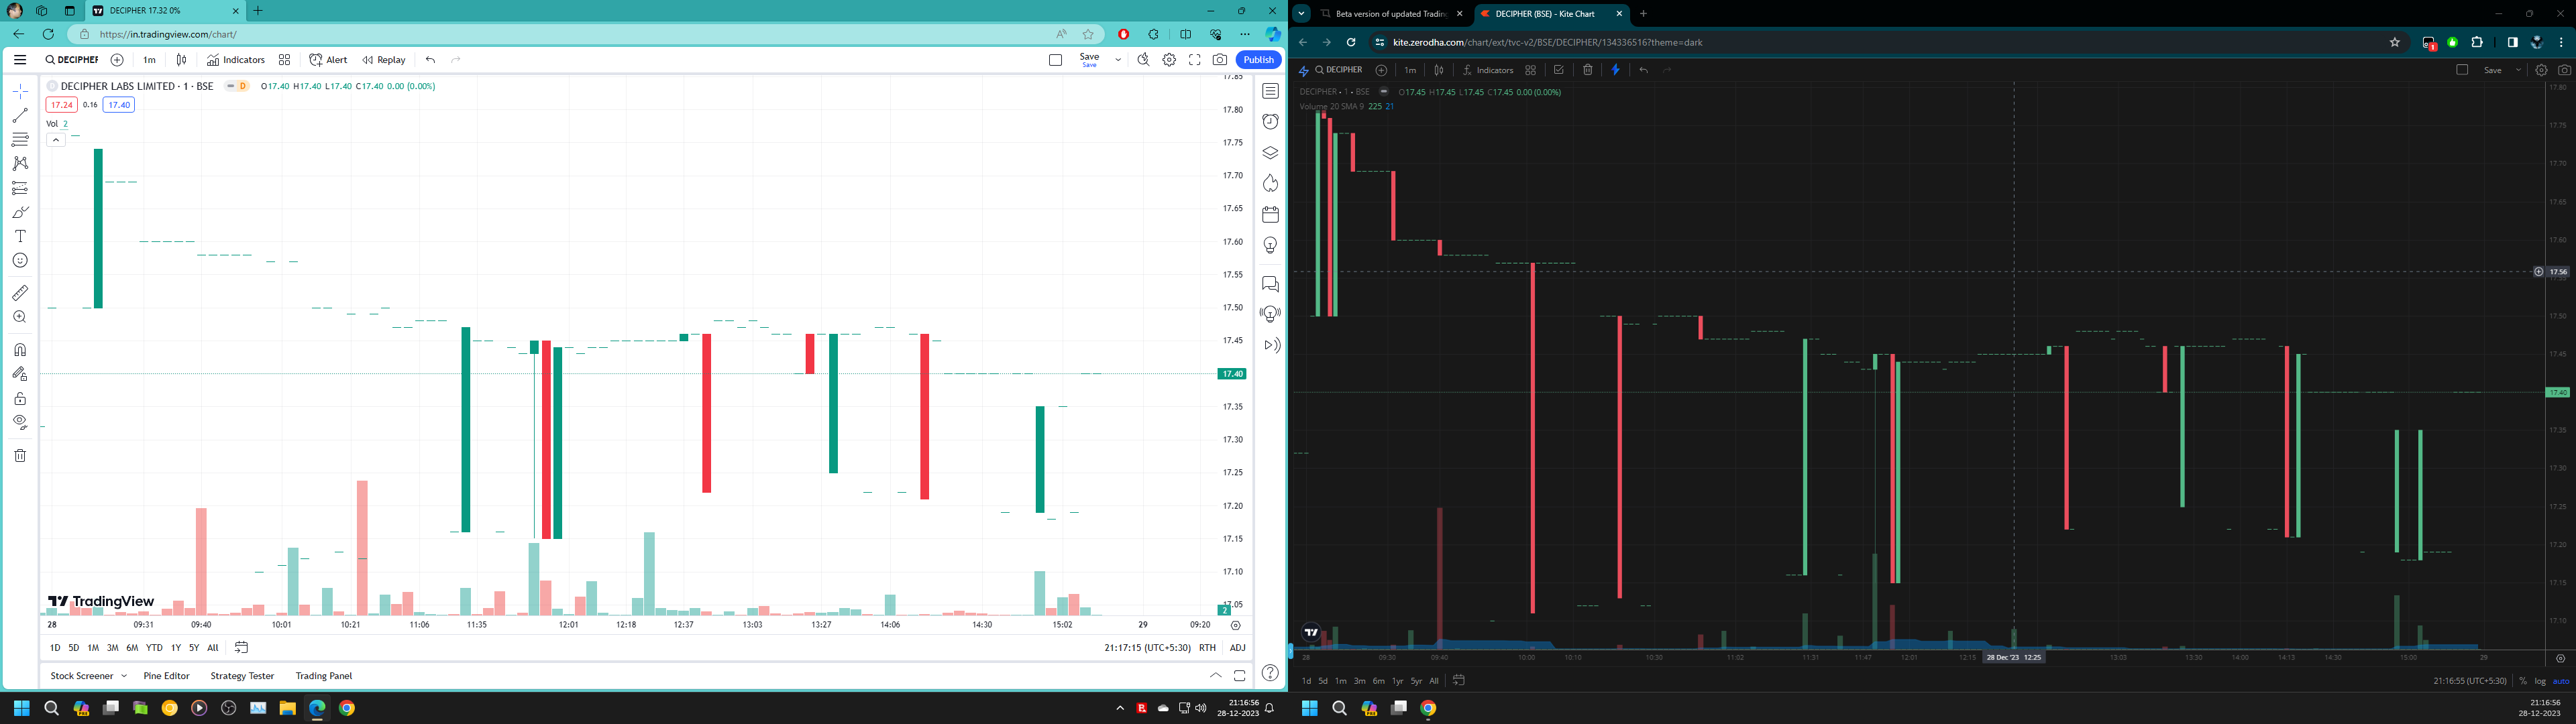
This is a screenshot of now… showing the stock’s volume in TV and Zerodha side by side…
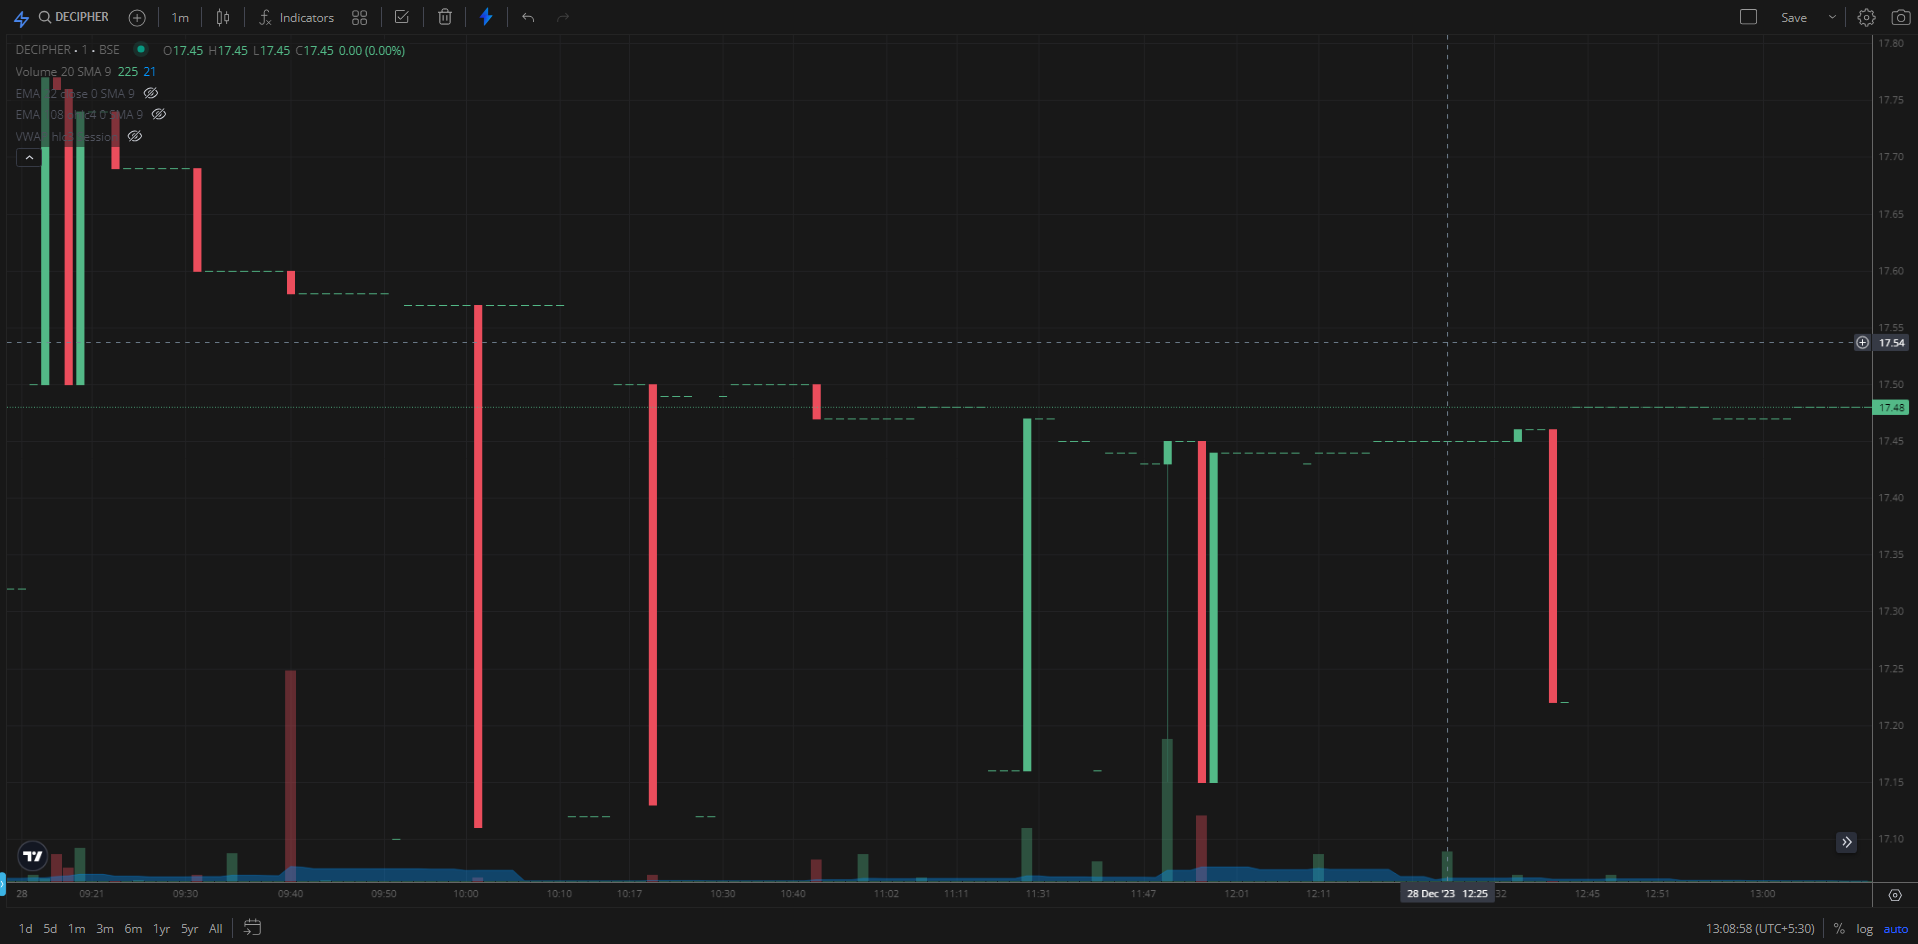
If possible can you share screenshot of what volume you see for this stock right now? Because it’s EOD’s chart and my volume of the trade I made is still not reflecting in Zerodha’s chart but is on the TV chart… Also the zerodha’s chart is missing good amount of volume data around 10-10:30 AM. If you or anyone can share Zerodha’s chart of this script with the volume data the discripency could be ascertained from which side it is…
In the above post I have shared enough details to go on… I don’t think this issue is from my end. If you still need I would be happy to share my ID. I have shared earlier but found this things or raising tickets don’t provide any constructive result. ![]()
If I have RSI indicator on my chart and minimize the indicator and save as default view, the chart does not save the minimized version of the indicator. So I need to manually minimize the indicator every time. Can this be fixed?
We understand your concern and are currently conducting an in-depth investigation regarding the missing volume data on the Kite chart.
The default layout does not seem to save this, we will check with tradingview about the possibilities.
Still there are problems with Tv2.0 Beta version. I am finding difficulty in applying Pivot Points indicator on the chart. For few it’s coming ,for few its not. Please rectify this problem. Thanks.
Sreenivas
Yes for some time i need to refresh the page.
If pivot not showing
Searching symbols in the trading view 2.0 charts does not return the chart. Example, If i search for ITC using symbol search and press enter, the chart does not come up. The issue is only when clicking enter
Do you use the Fibonacci pivot point? could you confirm.
Once you have entered the name, kindly use the downward arrow to choose the desired security, followed by hitting the ‘Enter’ key would open the chart.
how to use bracket order in zerodha.