Ideally, it should also work in Firefox. Chartiq beta is working fine on Firefox for us. Please create a ticket, and our team will contact you to resolve this.
It’s an amazing update, OHLCV and other indicator values are much easier to read now for each candle. Plus, CTB is like a cherry on top.
This is promising. Self-optimizing backtest based on plotted indicators ![]() Kudos
Kudos
I really like the new update!
my most fav features are the 1st one and last one
finally will be able to quickly add and navigate through the charts with shortcuts
And the game-changer feature of Kite and Streak of backtesting from the chart in a single click!!
I used to always wonder about creating strategies around the indicators I use but was never able to because of the huge efforts it requires. Never ever imagined it can become this easy and accessible with just one click !! This is some great work by Zerodha and Streak, thanks for getting this added ![]()

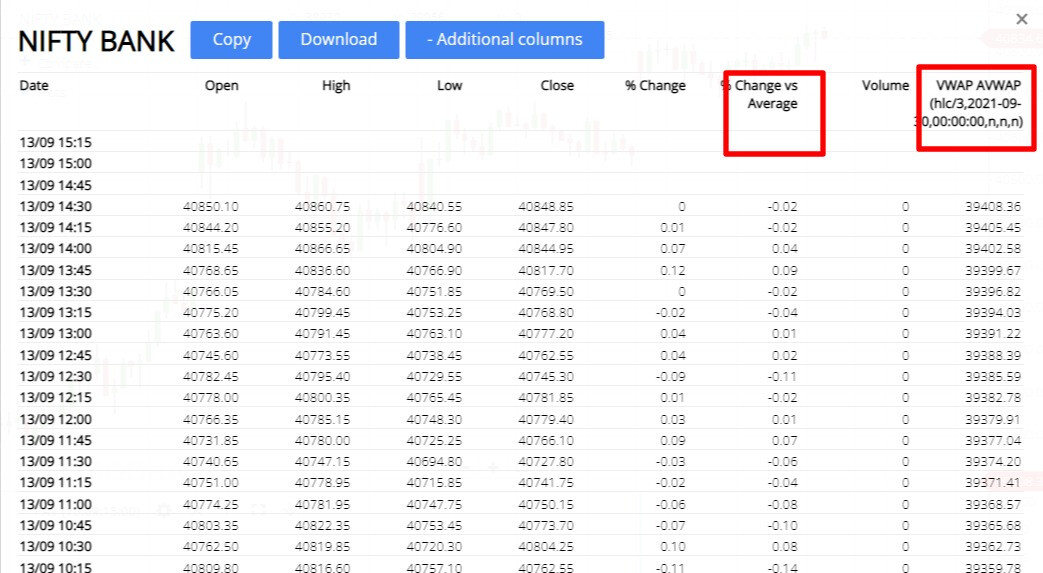
@Arockiya_Raja Sir did not understand these two columns
- Sir on what basis the strategy is getting selected upon?
Volatility Projection Cone — shows the price range that falls within 1 and 2 standard deviations away from the current price moving forward.
@Streak
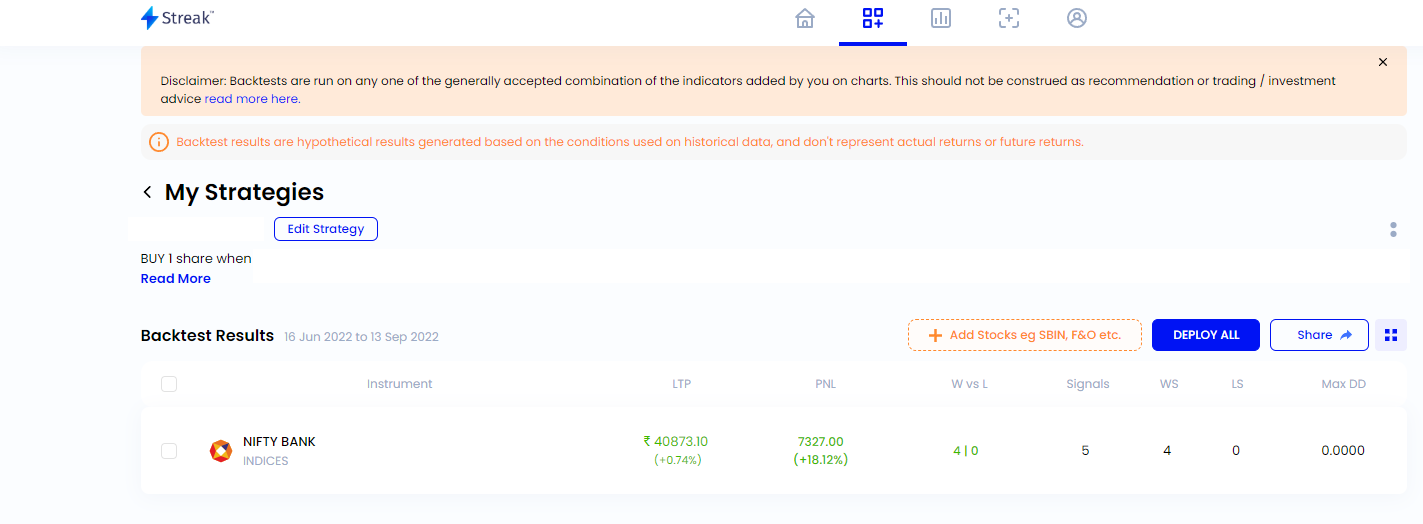
I don’t have a paid subscription of Streak. So for how long can I run the 10 free backtest per day? is there any restriction?
Hi how to use new indicator added? How to make profit
1 Like
No other restrictions, you can run ten backtests each day for free. If a user wants to run more than 10 backtests OR wants to edit strategy, then the user needs a subscription.
after reading this post I just tried the ChartIQ 8 and the Streak backtesting Chart to Backtest feature.
it works like crazy… a big shout out to Zerodha and Streak for bringing your synergies together.
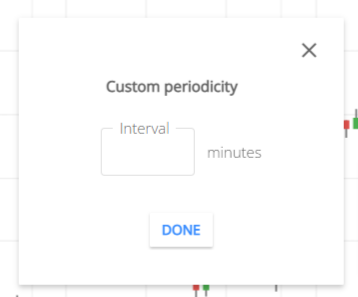
I have been waiting for this custom time frame feature since a long time, finally it’s here with this release.
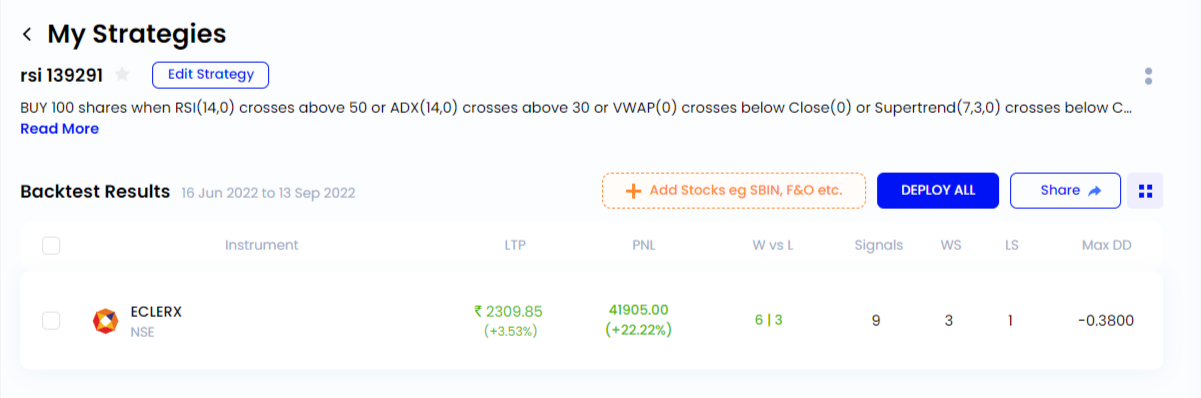
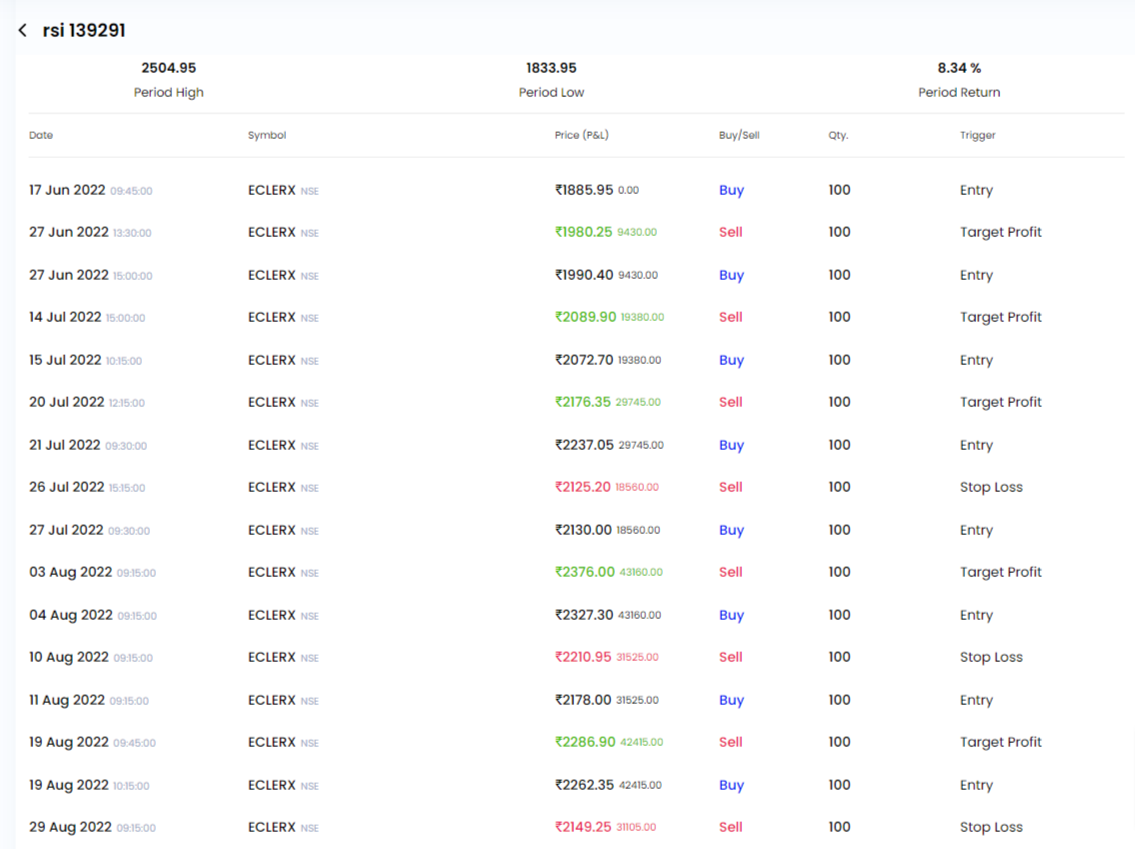
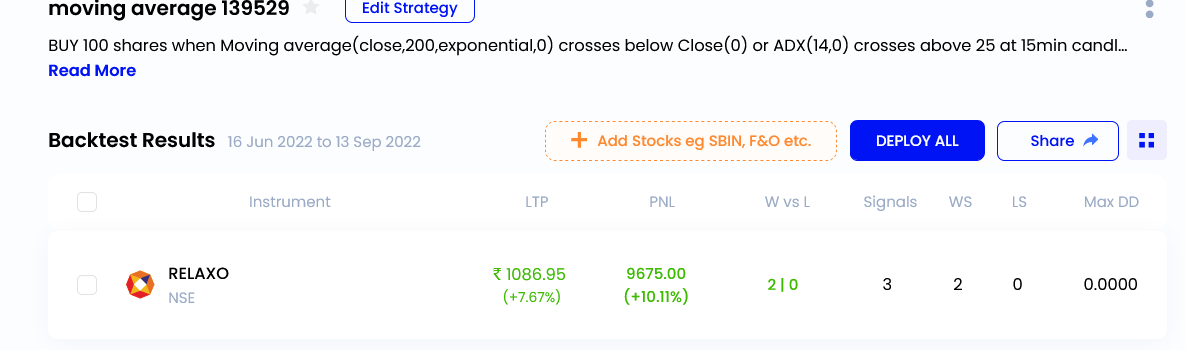
I just tried the new Chart to Backtest feature by Streak, it’s super innovative, always wanted to check how would my trading setup work in the historical data, initially it used to take hours for me do this all manually, but now just a click away. After clicking on the Streak logo, it automatically backtested the stock.
super impressed guys… keep up the great work.
1 Like
just ran my first Chart to backtest on the streak and super amazing to see how simple and effective our ideas are actually translated into the language of technical analysis. can’t thank you enough
I tried after market hrs. 2 out of 5 times it by default opens with 1d Time frame and stays blank. rest of the times it opens.
am a price action trader who wants a clean chart who don’t use indicator, hence indicators,streak etc all are useless to me, anyway i don’t complain about this.
things i don’t like
when opened every time it goes to 1d TF by default and when i try to open the chart in nxt tab for full screen it stays blank(white paper) issue happens with Nifty and Bank nifty, btw I trade only index options.
The another major issue is line spacing between candle is poor, zoomed in zoomed out multiple times but what i got in verison 7 is not here. either candles go big when zoomed in or when zoomed out the candles are so close making it ugly.
so its a beta version. let it be. please don’t remove version 7, let the users make their choice.
This should not happen. will arrange a callback to understand the issue.
1 Like
Its ok, I have checked in chrome as well, the issue happens with firefox alone. for me sometimes during live trading chrome goes dormant, hence I use firefox. I’ll use chrome If i need the latest version. callback not required, If any assistance required i’ll raise a ticket.
thanks for the response.
1 Like
I ran 1 test, and got a message that backtest limit reached for the day, and that I have to upgrade. I am disappointed.
I tried the chart to backtest feature and was very amazed by the tool and feature launched by both the Kite and Streak team. The combination of indicators I backtested on Streak using Chart was easy as I could backtest my idea with just one simple click. I will now subscribe to the Streak platform and use this facility to the fullest of my potential as the problem before this I was facing was about writing the conditions manually which is now solved.
2 Likes
I was able to run 10 for free bro check it out once more. Ya but after 10 you will need to subscribe to Streak.
1 Like
I logged in, back tested the added chart once, and just within seconds I got that message. I don’t know why this happened.