I took the subscription, as I had to run a few back tests. I will create a ticket if the problem arises in the future.
@Arockiya_Raja There should be shortcut/hotkeys for popular charting Times frames at least.
it should be very easy to switch between say 5m/ 15m/ 1H/ Daily/ weekly
2 Likes
Excellent very necessary update. Please add option for save custom timefram in list. It will be better
1 Like
Your feedback has been noted. We will check into the possibilities.
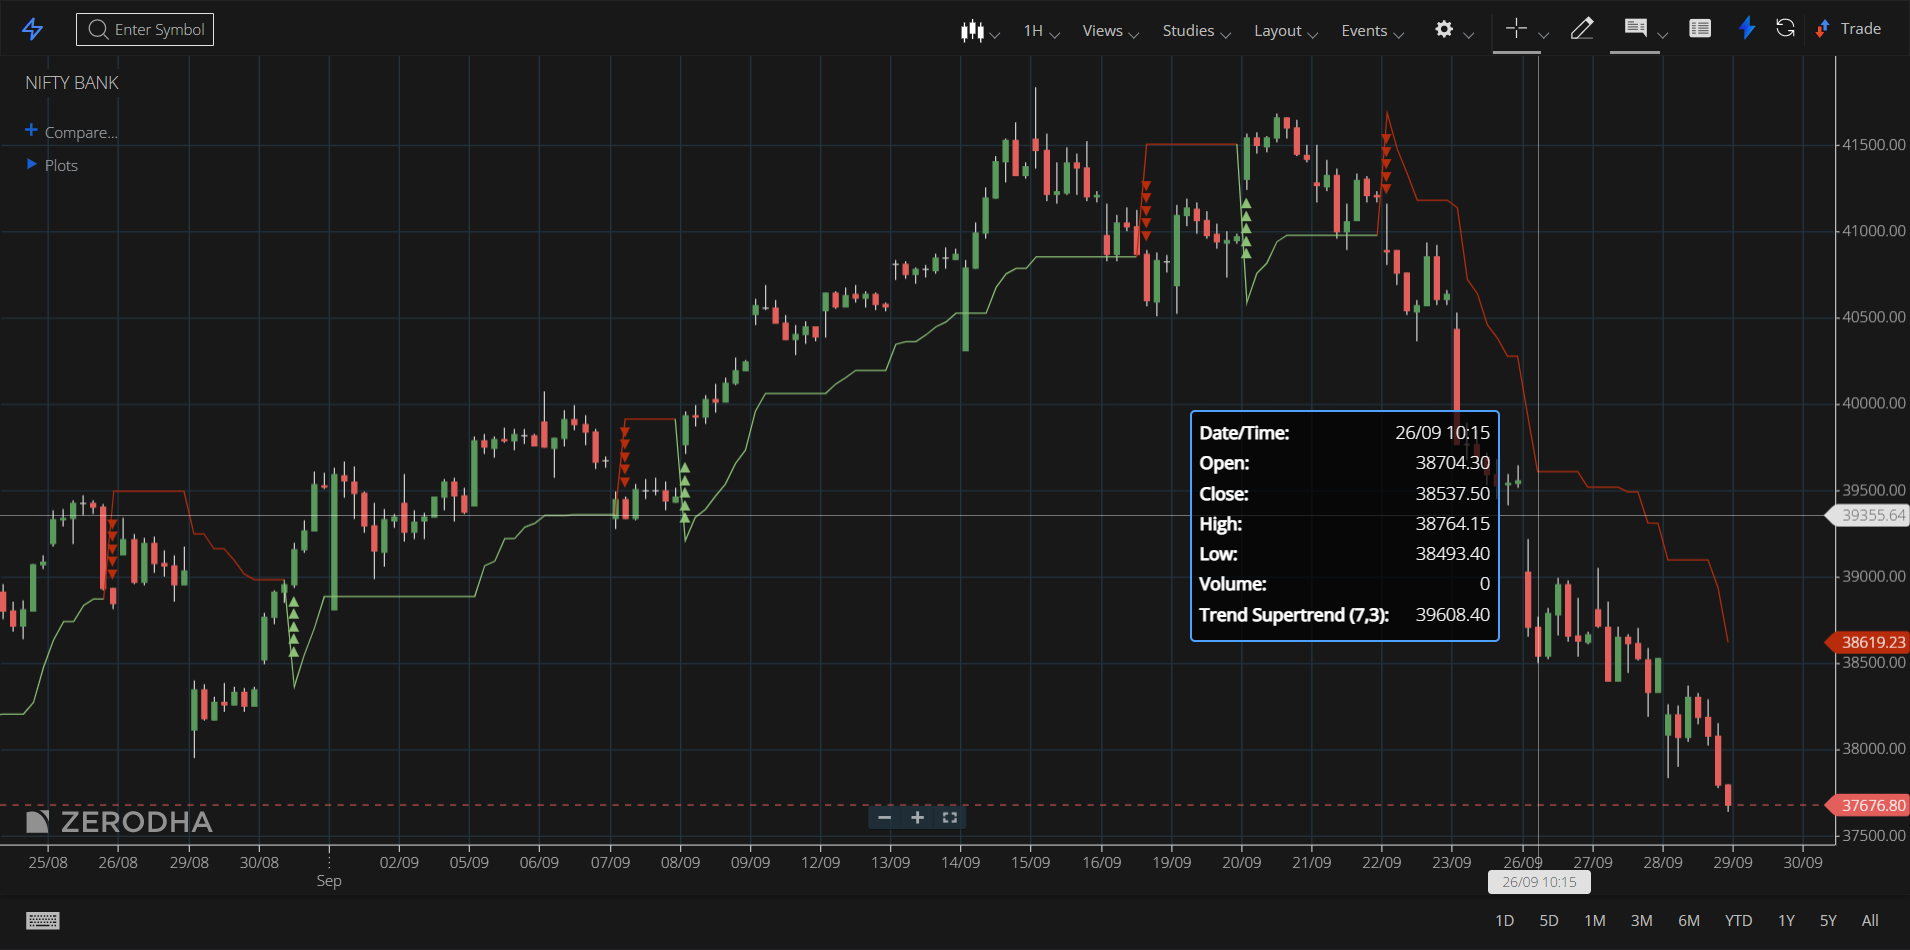
It seems you have applied anchored vwap. It is the indicator value that you see on the chart that is displayed in the table.
The difference between the average percentage change and the percentage change for a particular time period.
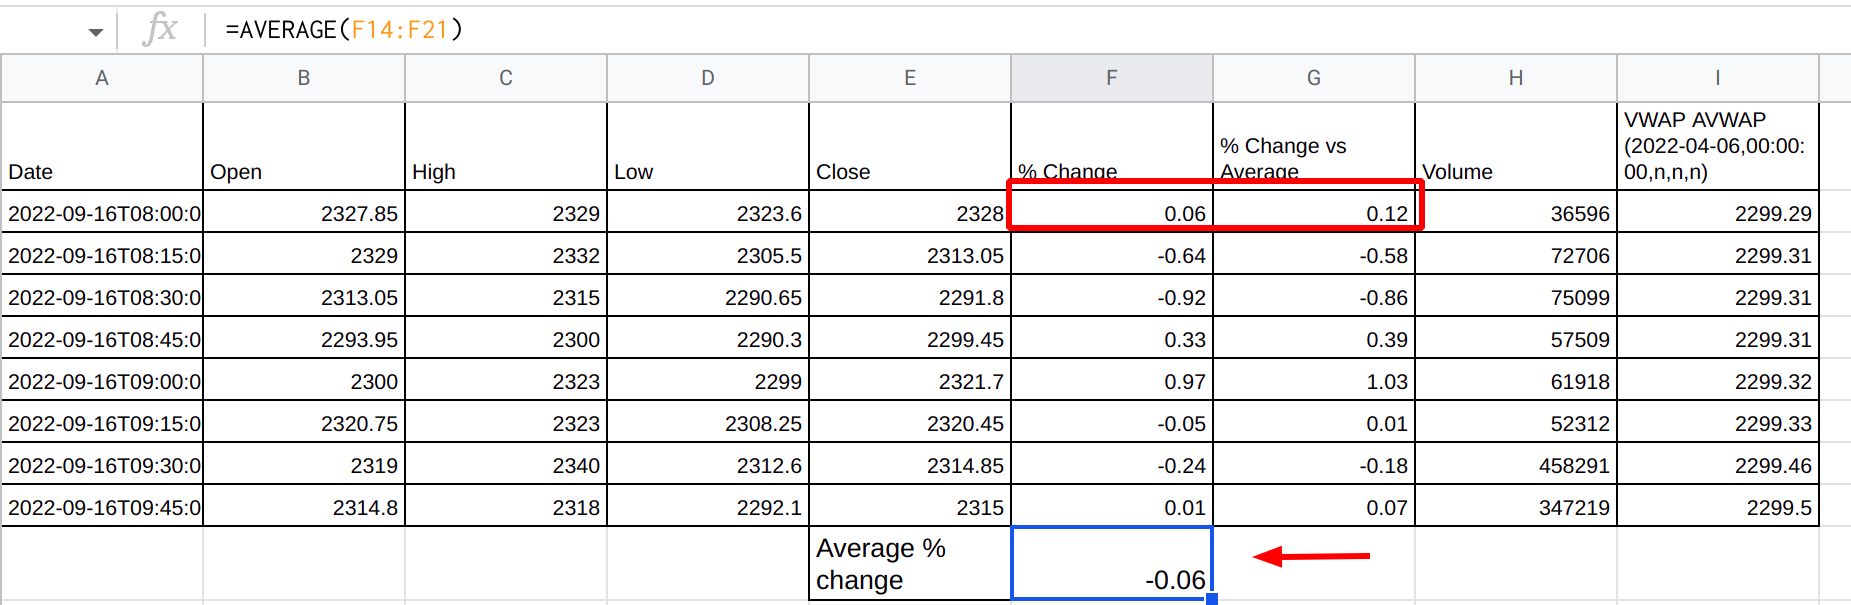
As per the above screenshot, the average percentage change is -0.06, and the percent change of the selected column is 0.06.
percentage change vs Average =0.06- (-0.06) = 0.12
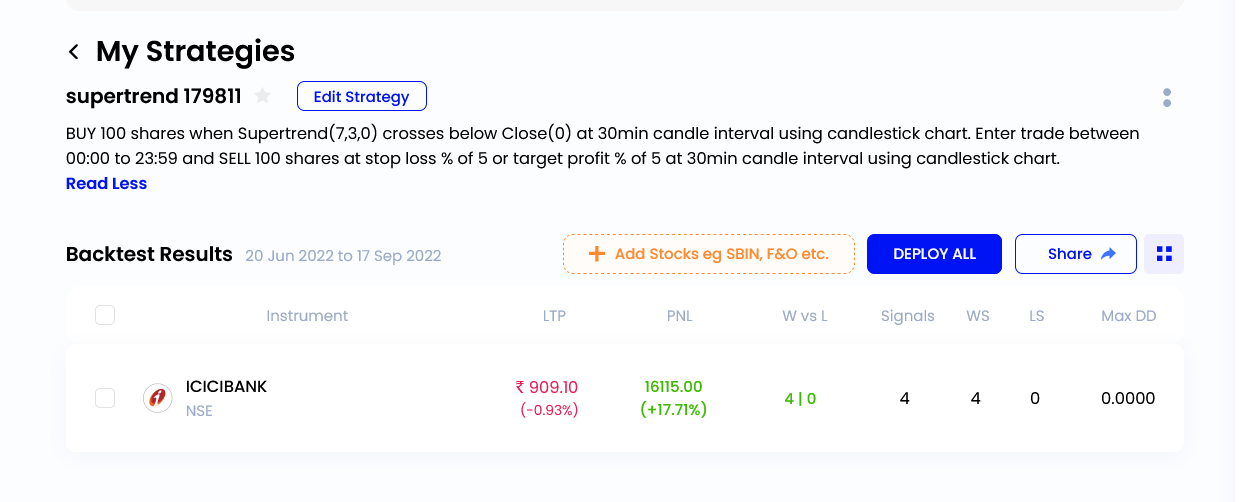
Backtesting supports 21 indicators, which can be found here. If the supported indicator is used, it will select any of the commonly used strategies. If no supported indicator is used, a backtest based on price action will be performed. The strategy can be found at the top of the backtest report.
Noted, we will check the possibilities. Users can save custom timeframes and indicators in views and load them later.
really kind of enjoying this CTB feature. Amazed to find how simple indicators can help in understanding trends in an easy way.
1 Like
hi, can you pls share the strategy conditions? looks interesting!
@Arockiya_Raja
I am not able to see the OHLCV values on the top in ChartIQ 8 as visible in your screenshot -
Your snapshot
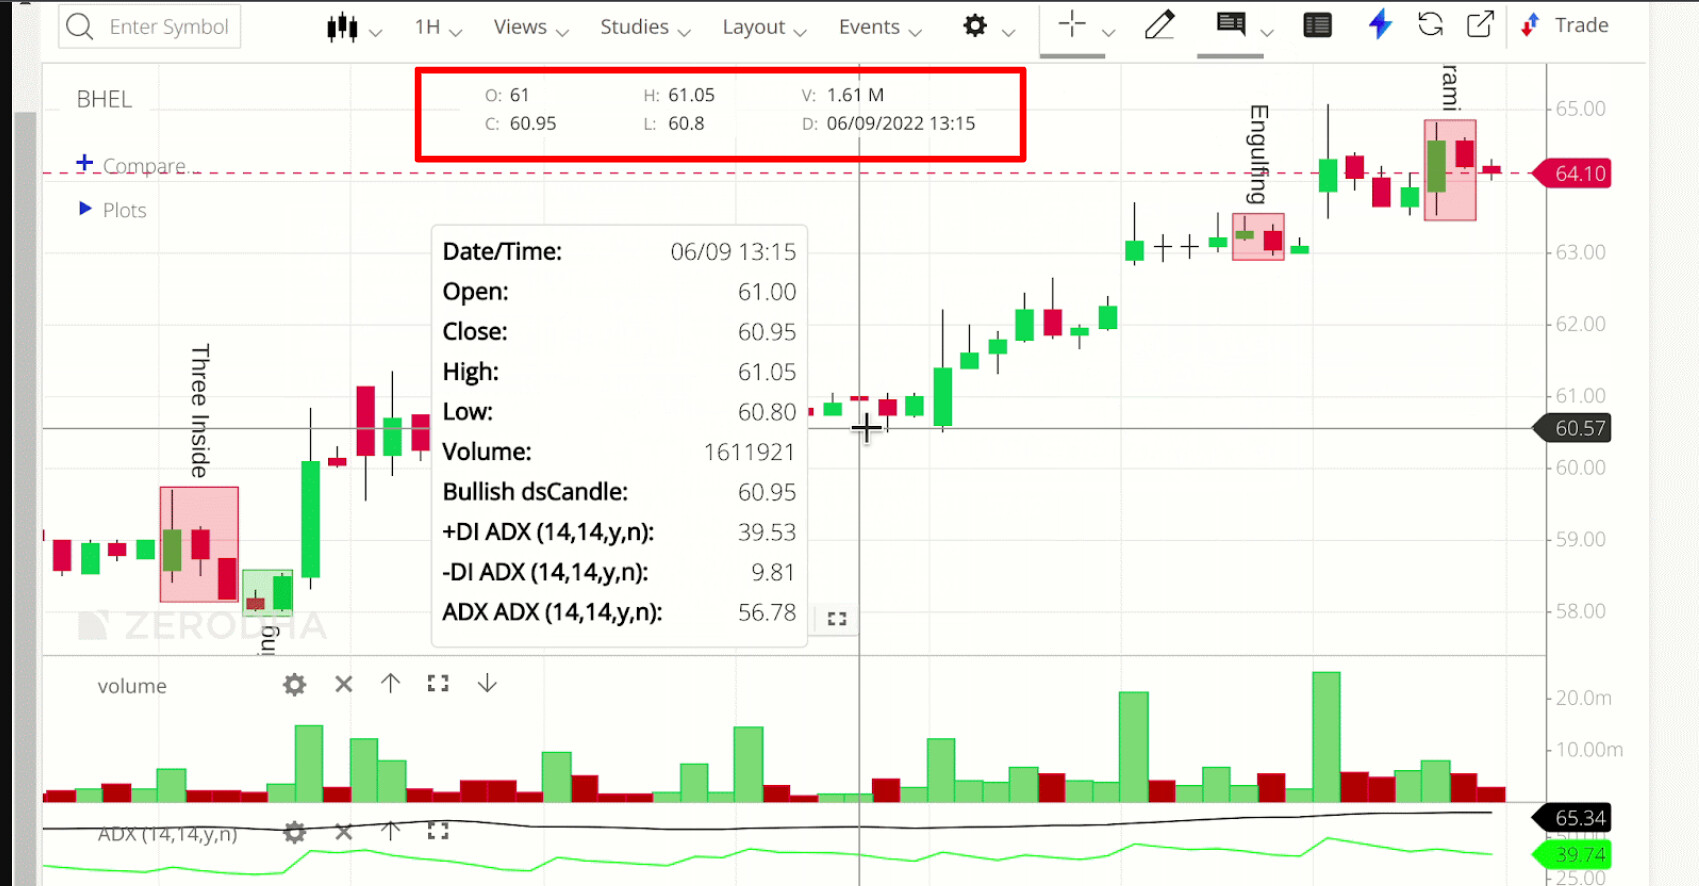
My snapshot -
hi when in do it unable to see chart … any solution for that ?
Can you add more details? Is Chartiq 8 opening a blank page? A screenshot might help.
The prior version of Chartiq has been phased out from Kite. The new Chartiq has been rolled out to everyone.
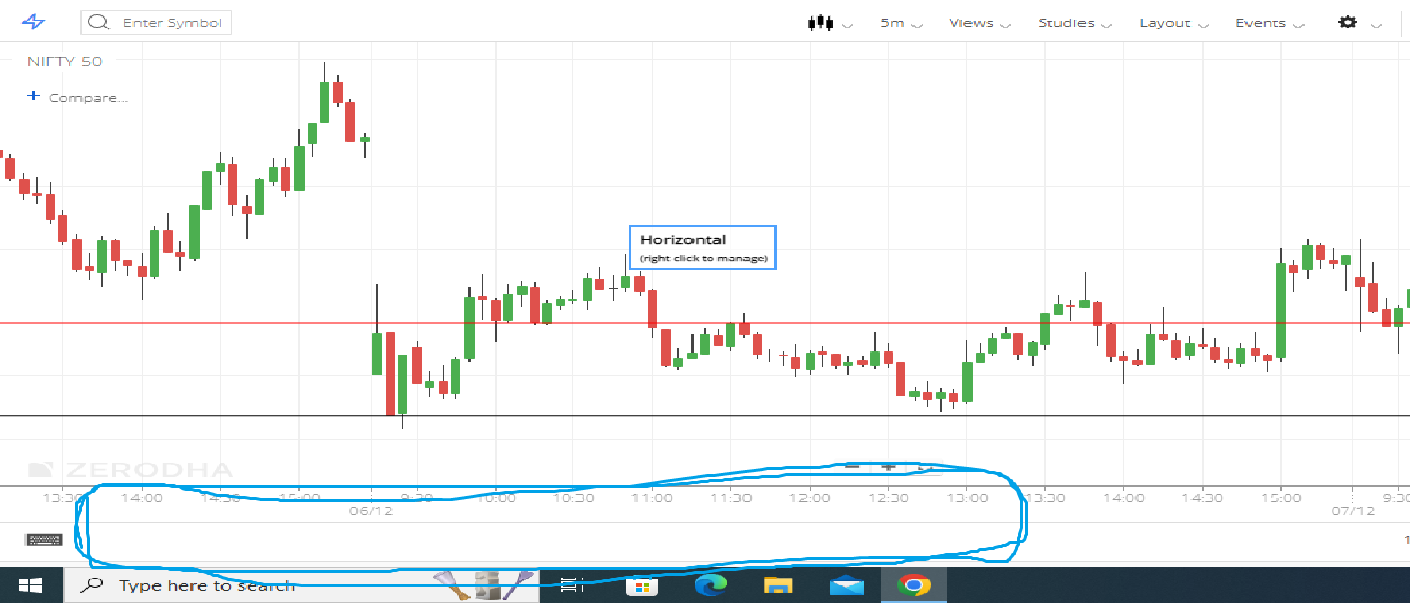
Thr shld be a prominent line whn a new day starts before 9.15 candle (like it ws thr in old version) … i hv to analyse arnd 100 charts everyday in 45 mins in morning (frm 10.30 to 11.15) … its v.less time n lot of charts … nw i keep locating 9.15 candle in every chart thn move the cursor to locate 9.15 vol candle n thn 9.15 price candle … kindly consider adding a prominent line like it ws before
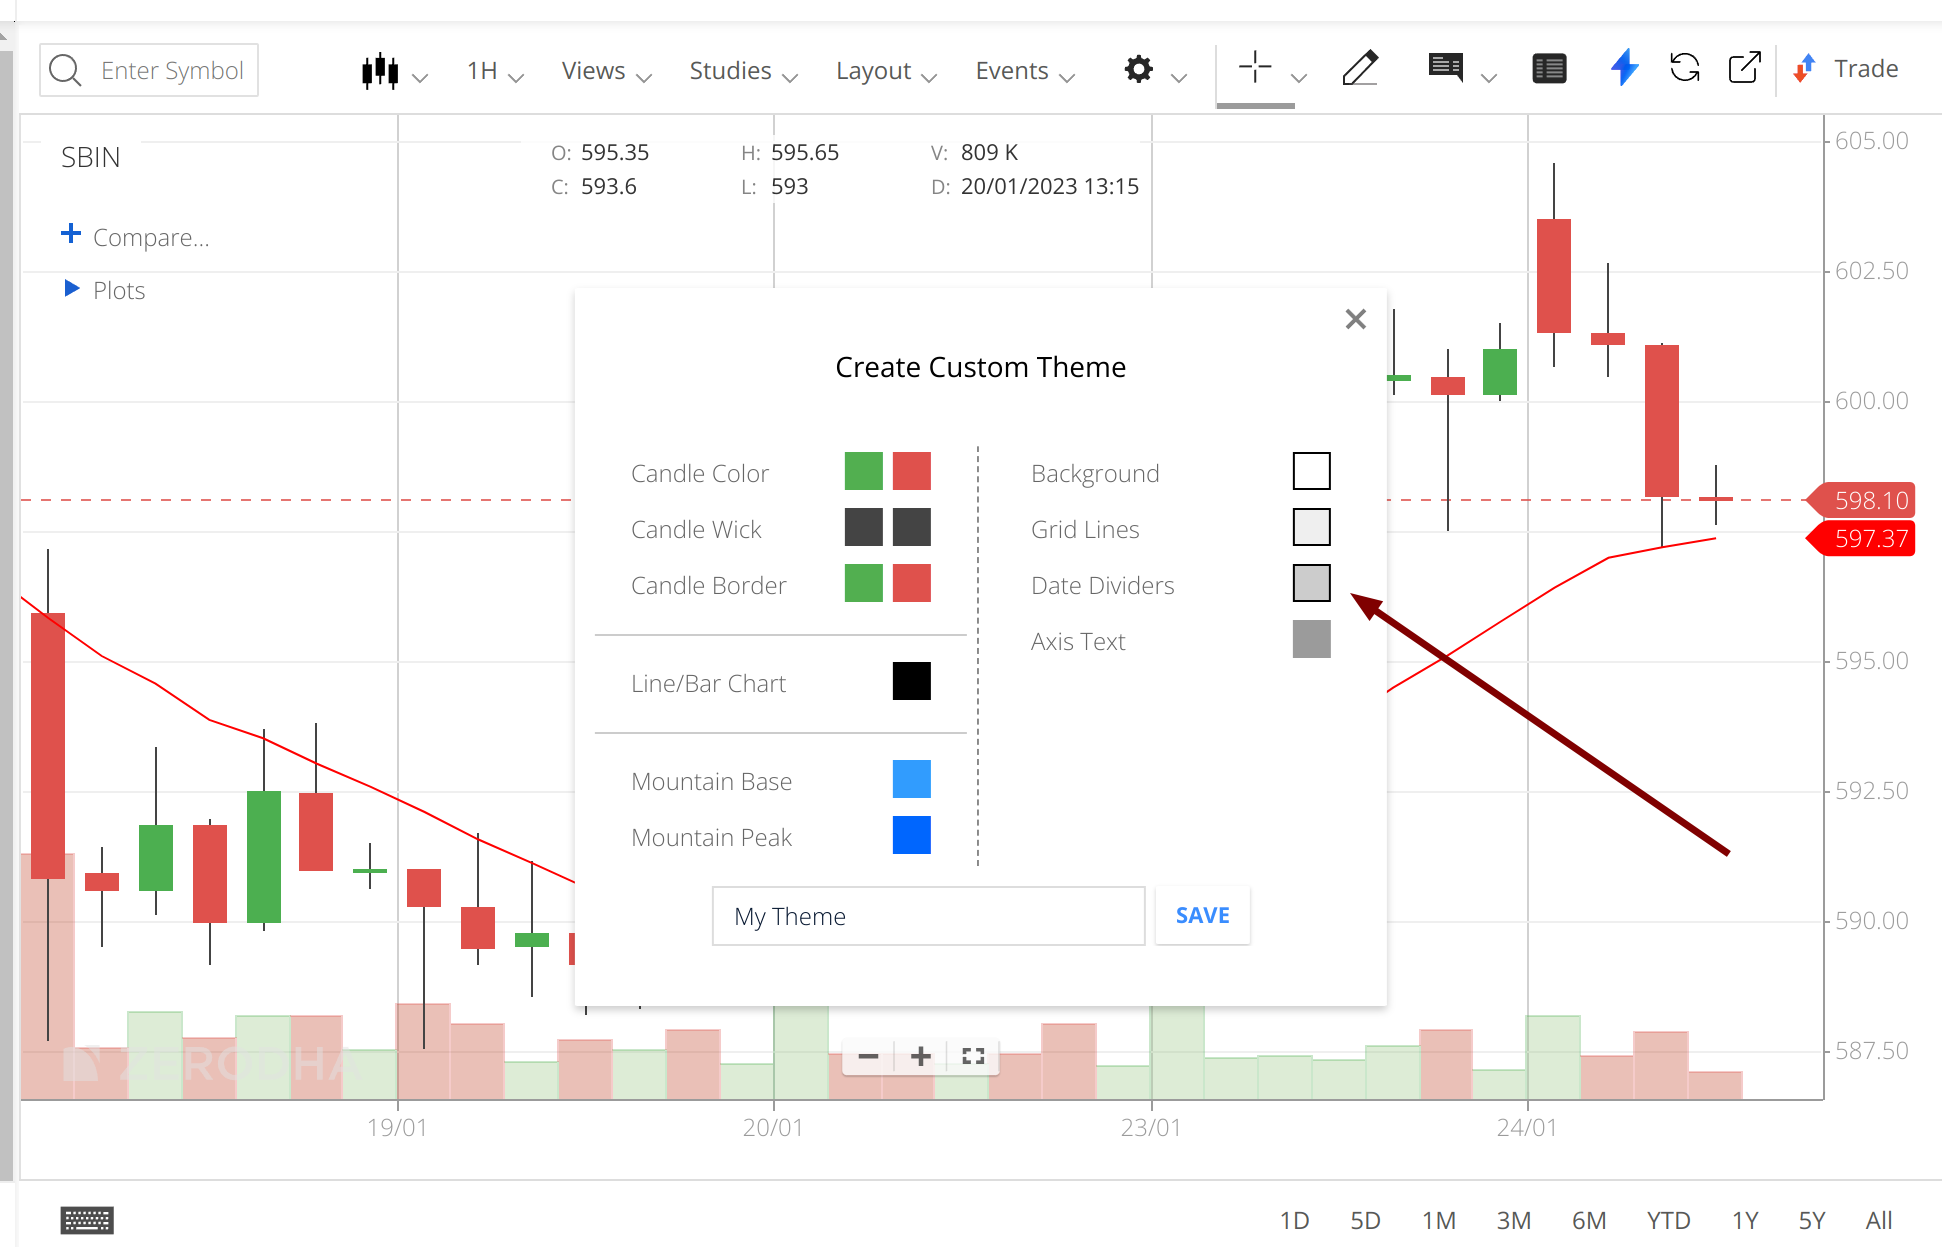
ah, seems the line is available, but it is not darker like the previous version.
You can change this setting under the theme to make it visible like the previous version.
1 Like
Thanks a ton ![]() … tht solved my problem
… tht solved my problem
1 Like
It’s good that a lot of chartiQ updates are live on kite however can’t the same be with Trading View i think there’s much scope for trading view to be updated too
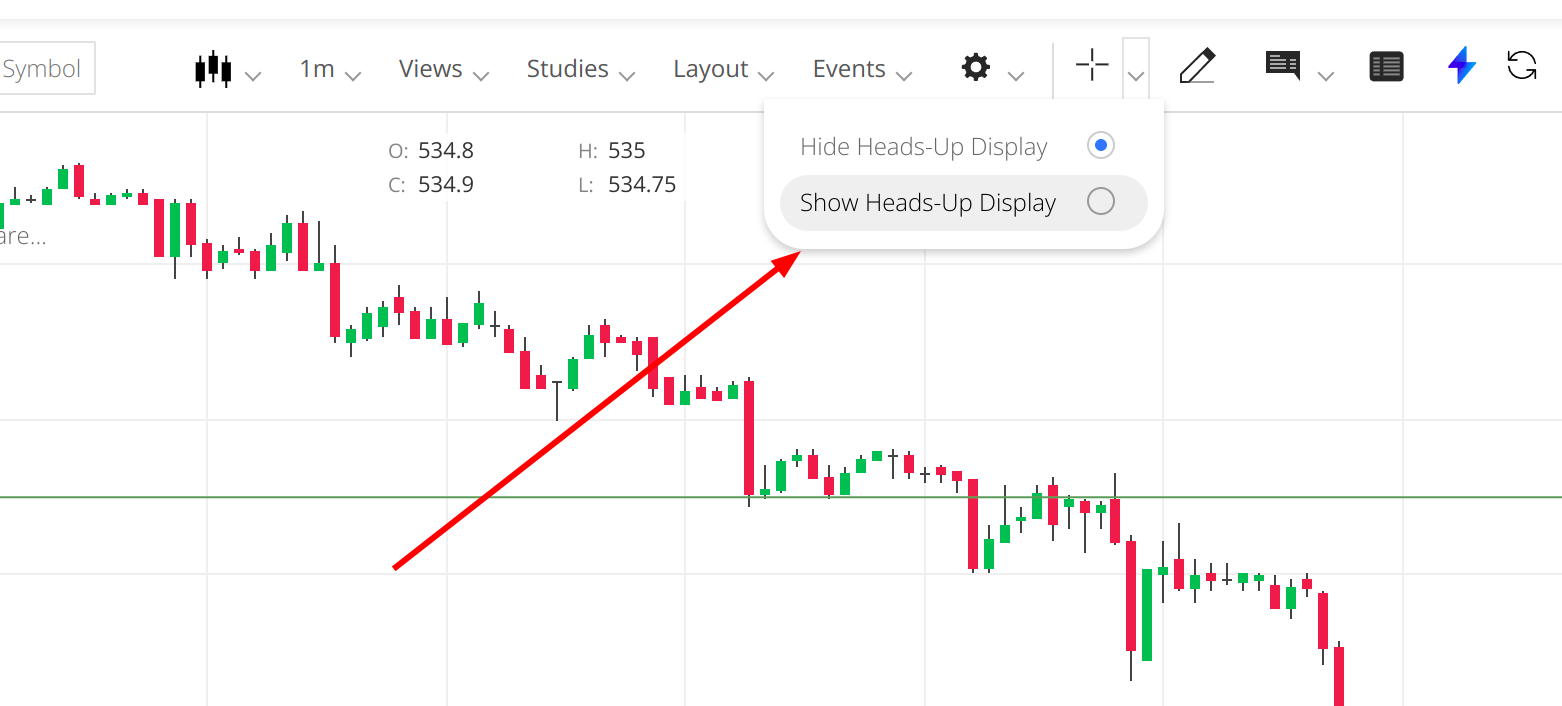
Hi. Is there a way to disable dynamic callout and tooltip and only enable heads up display as a default?
Every time I switch to a different ‘View’, that dynamic callout shows up and I have to waste time disabling it and enabling the heads up display. Even saving preferences does not seem to work for this.
Pl let me know.
1 Like
Anybody from Support watching this thread? No reply for 5 days to my query above…