The latest version of Chartiq has been integrated into Kite Web. This post contains a list of new Chartiq features that everyone needs to know.
How to switch to the new chartiq?
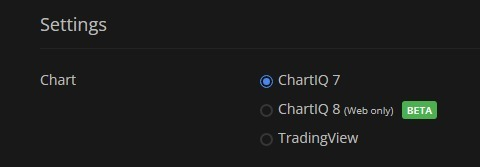
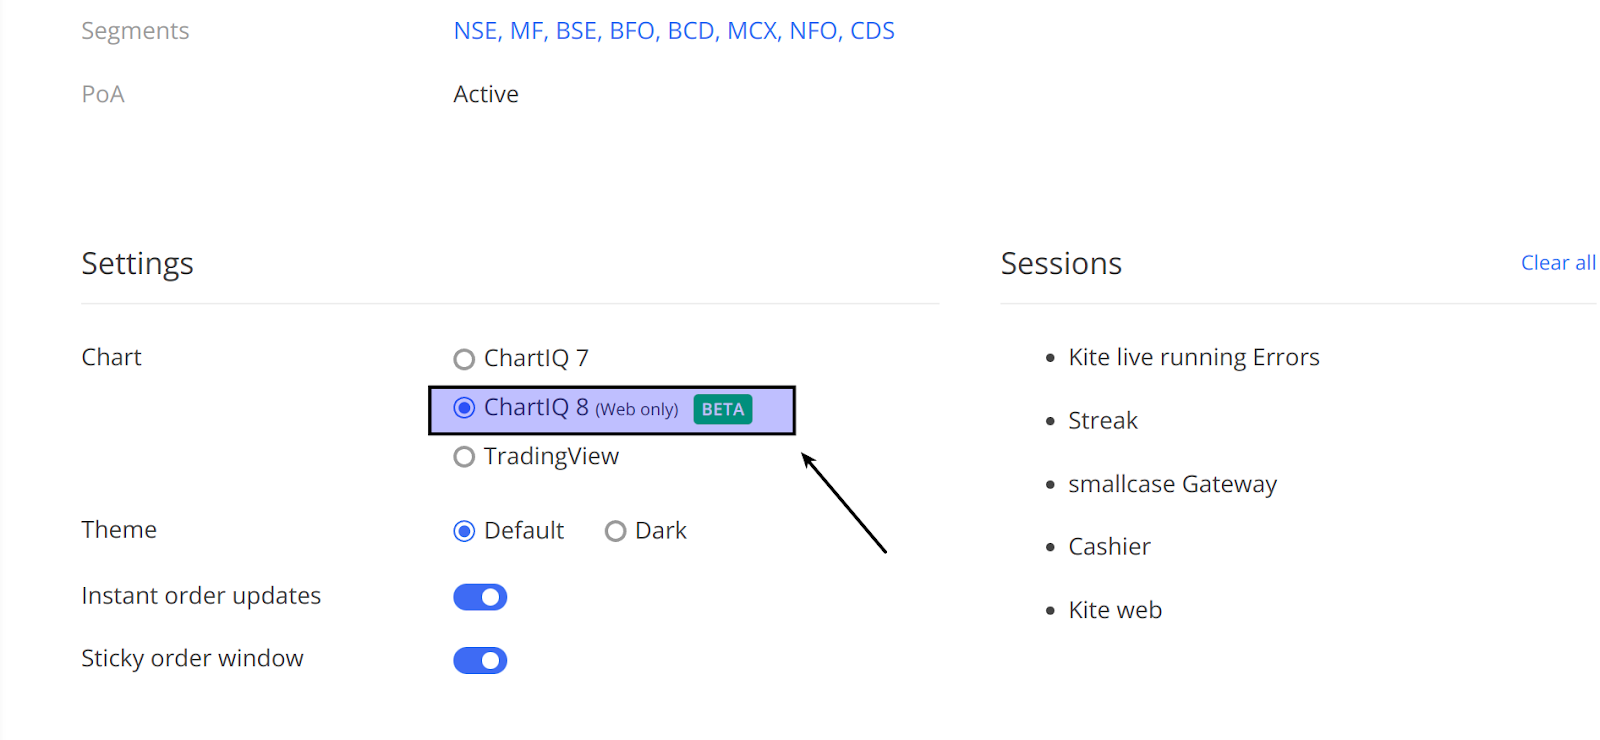
Select Chartiq 8 (beta) under settings from the kite web profile page. For the time being, the new chartiq has been added as an additional option under the settings.
List of new features:
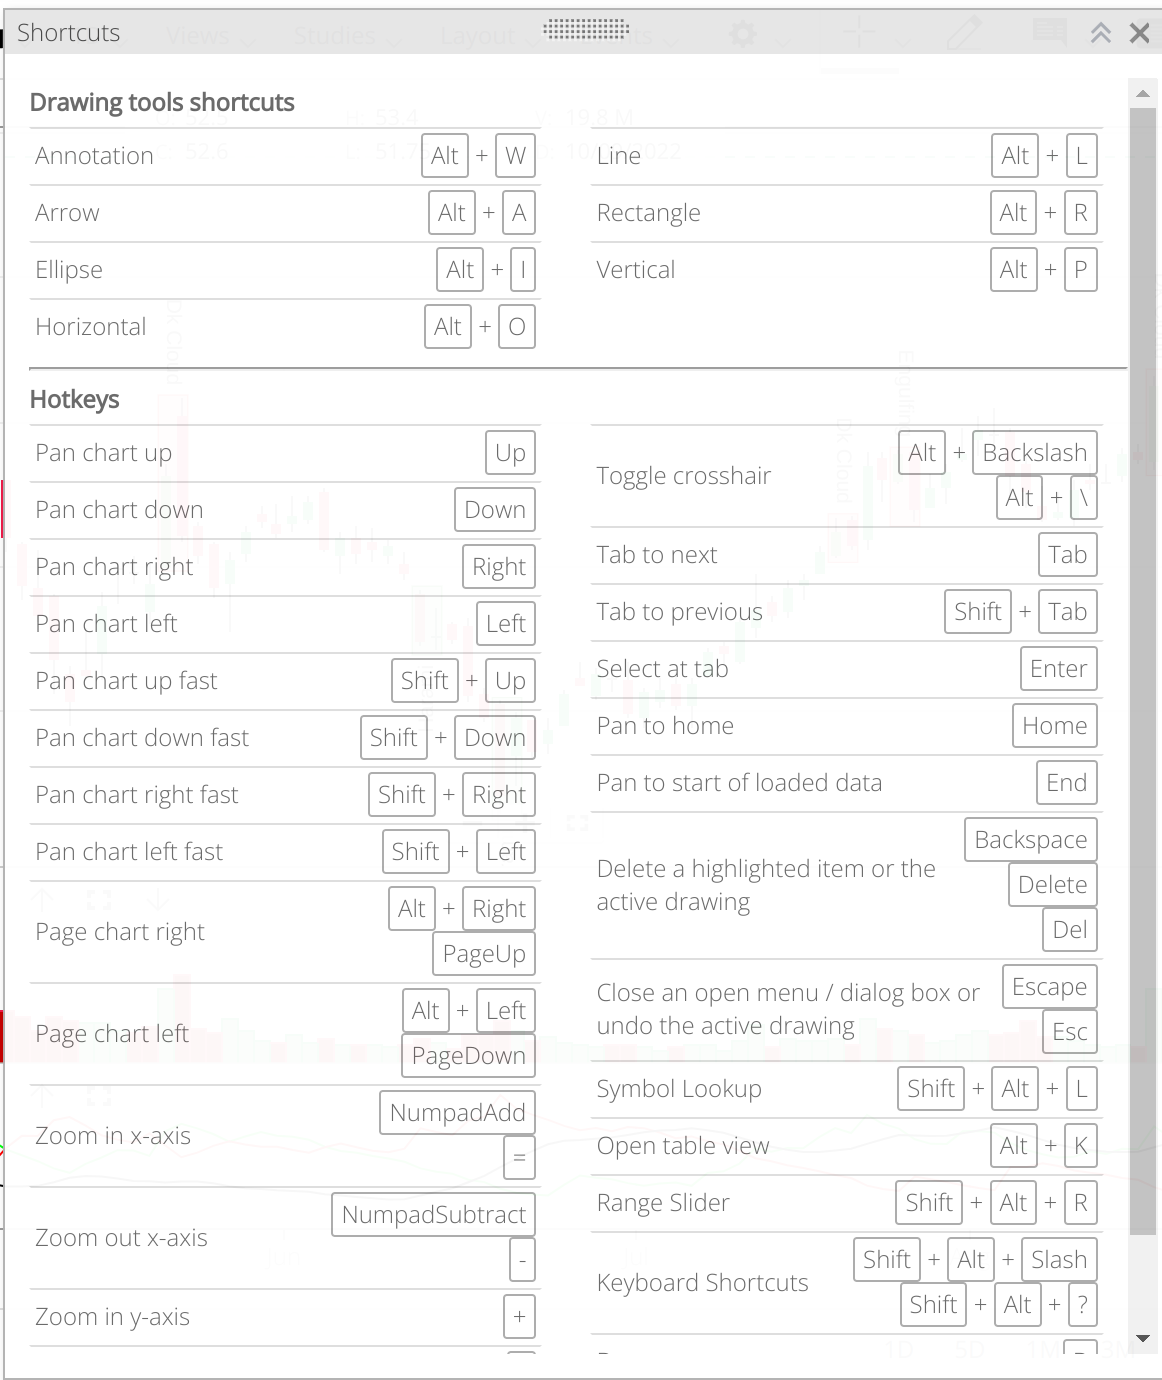
- Shortcut keys for various functions: One of the frequently requested features is shortcuts for drawings. This is available on chariq now.
- Custom timeframe : Traders want to go beyond traditional methods of analysis. Now, users can study market behavior in various timeframes by switching to custom timeframes.
- Chart data to Excel: Now we can download chart data to Excel and perform various data analysis with Excel formulas as needed.
-
New indicators: Projected Aggregate volume, Projected Volume at time, Volatility Projection Cone, Moving Average Cross, Guppy Multiple Moving Average, Enhanced anchored VWAP with a vertical line to click and drag.
-
New drawings: Elliott wave, Magnet, Volume profile by date range.
Volume profile by date range.
-
Pin favorited drawings: when a drawing tool is marked as a favorite, it is now pinned to the top position in the tool list.
-
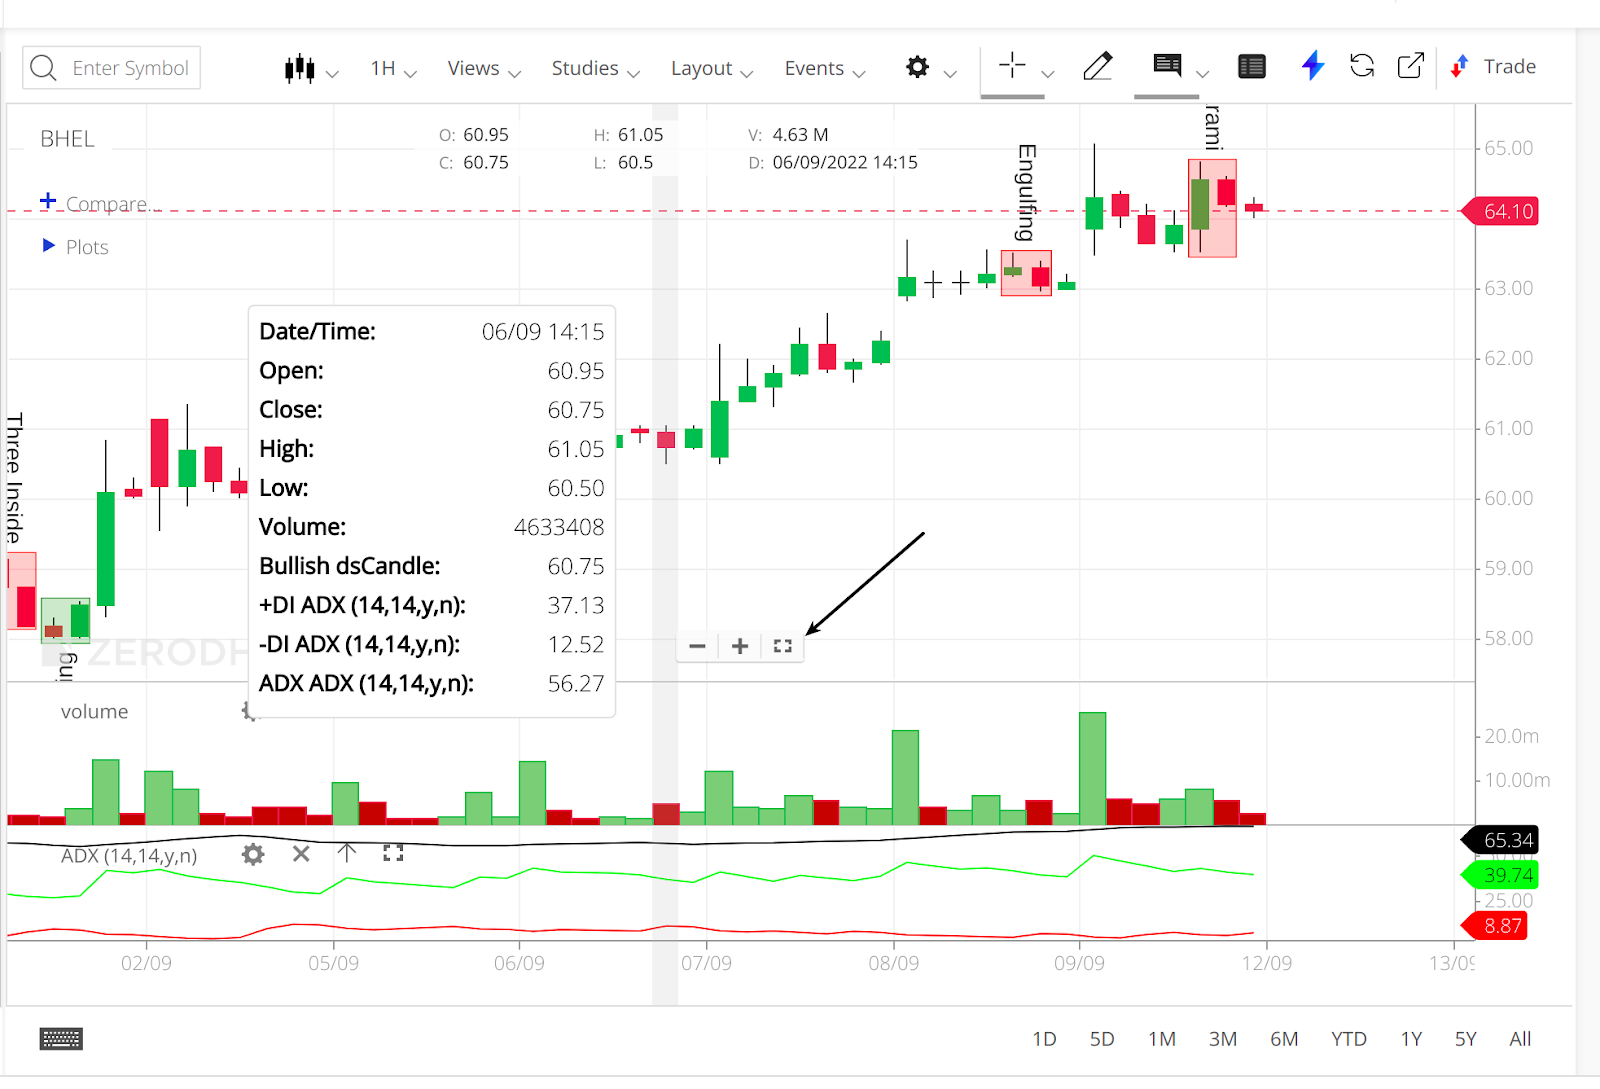
Tool tip: It is useful to see accurate historical indicator values.
- Fullscreen feature: We can view charts in fullscreen mode for improved visualisation.
- Detach and attach the drawing tool bar: We can detach and relocate the drawing tool bar.
-
Continuous chart data is added to currency contracts.
-
Enhanced the user interface:
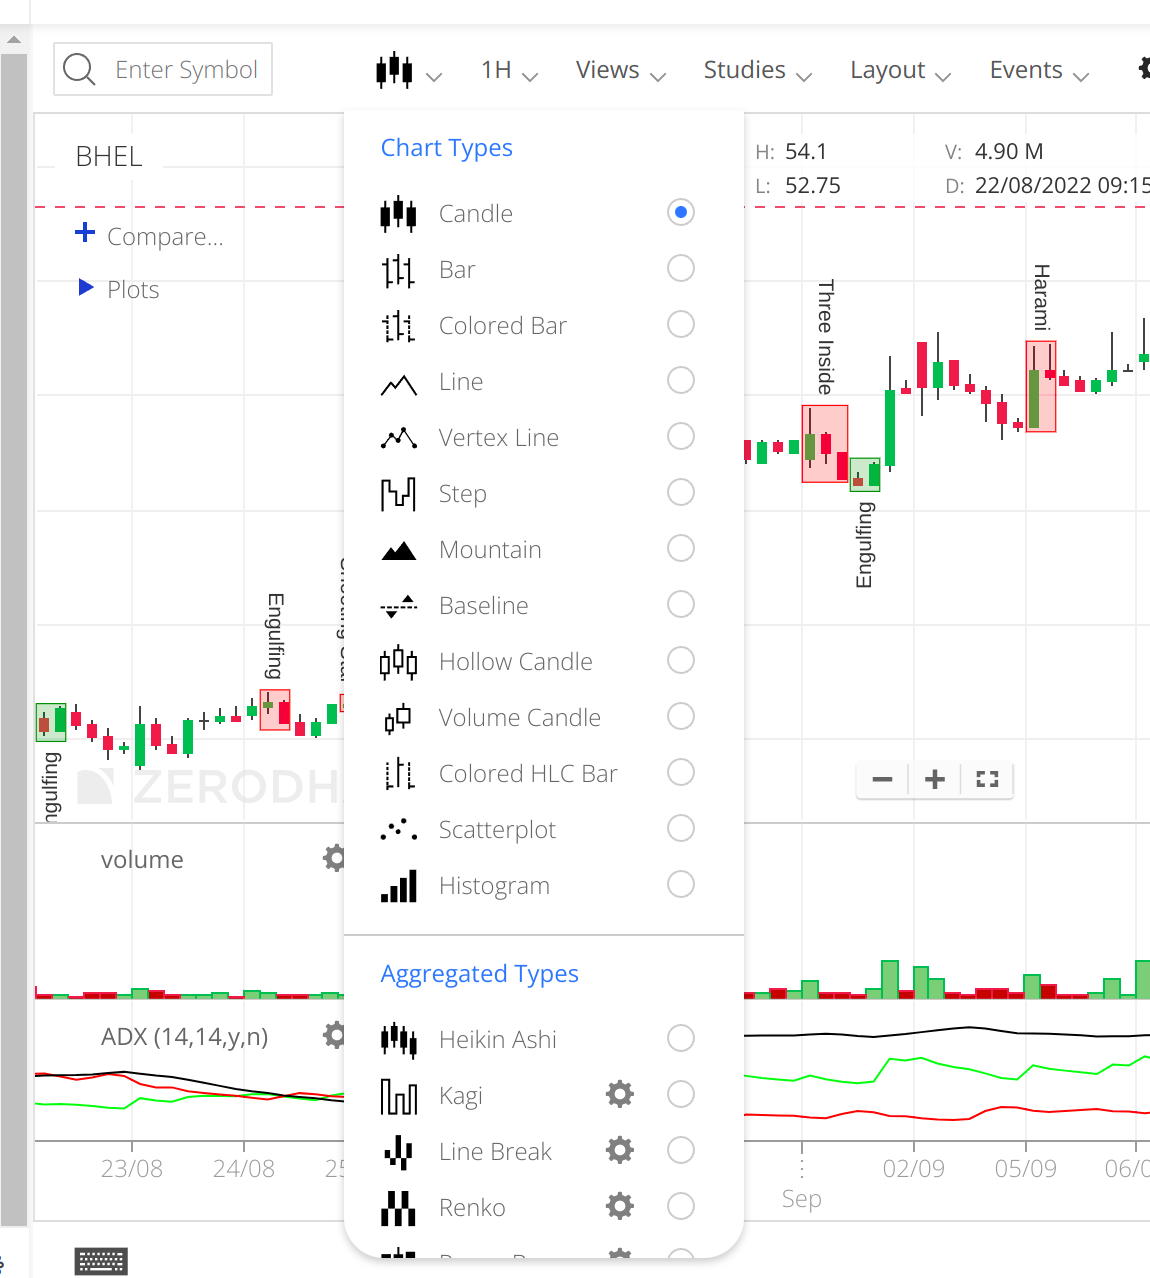
Updated menu styling — dropdown menus have been enhanced with rounded edges, switches instead of checkboxes.
Icons on Chart Types menu — icons have been added to the Chart Types menu for easier recognition of chart types.
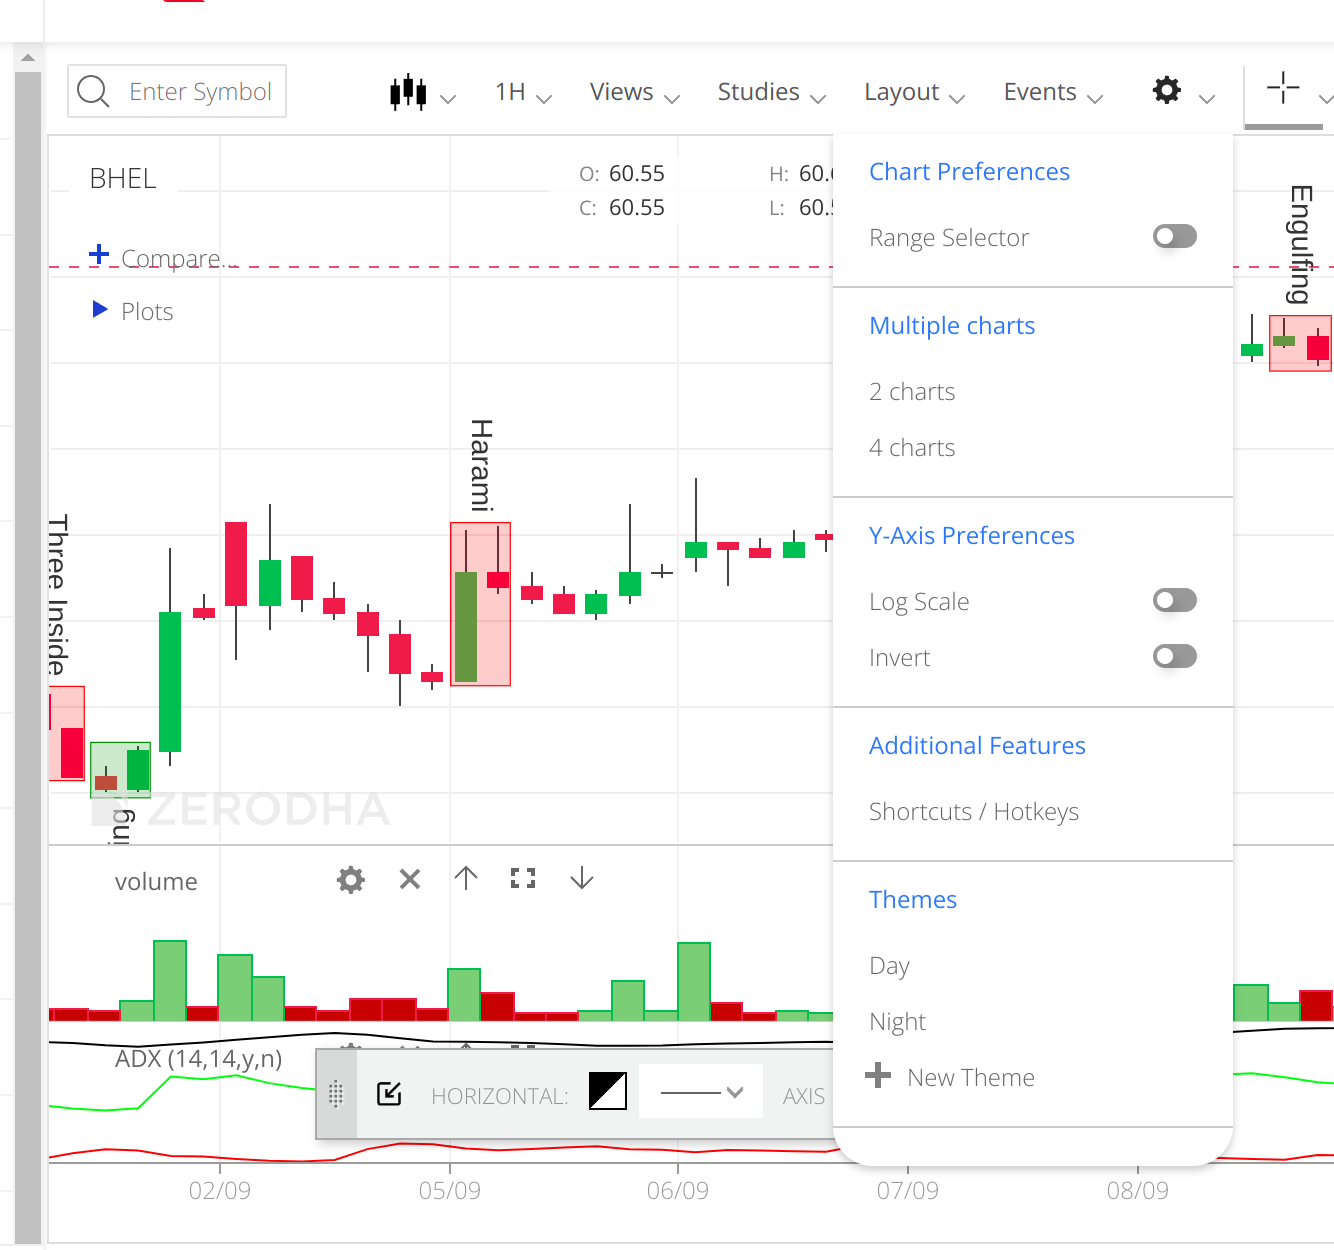
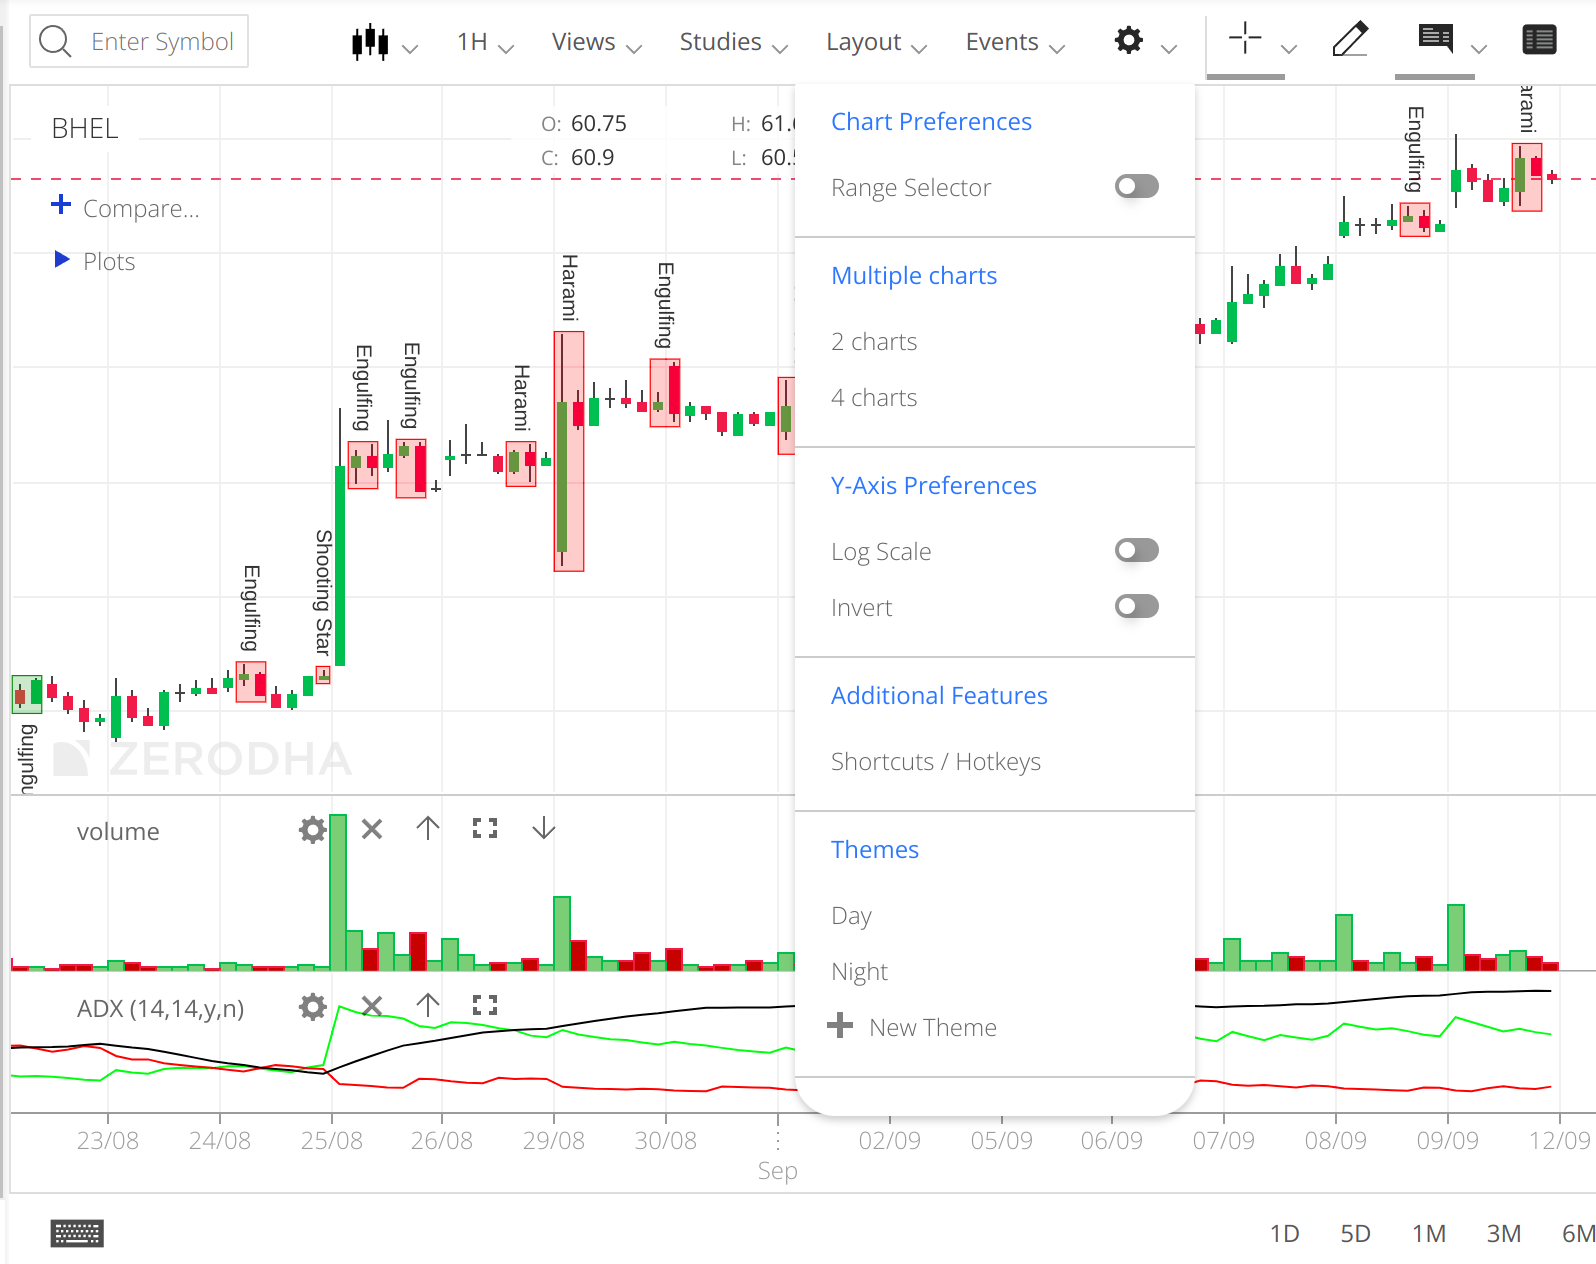
- Dedicated settings button with the following menus. Range selector, multiple charts, continuous charts, yaxis preferences, and themes.
-
X-axis labeling based on calendar priority - X-axis labels now display on two lines and are based on calendar priority to highlight the beginning of a unit of time.
-
Trade from chart: When we place a buy order above the CMP, trade from the chart places SLM orders. In the new version, SL orders will be placed instead of SLM.
-
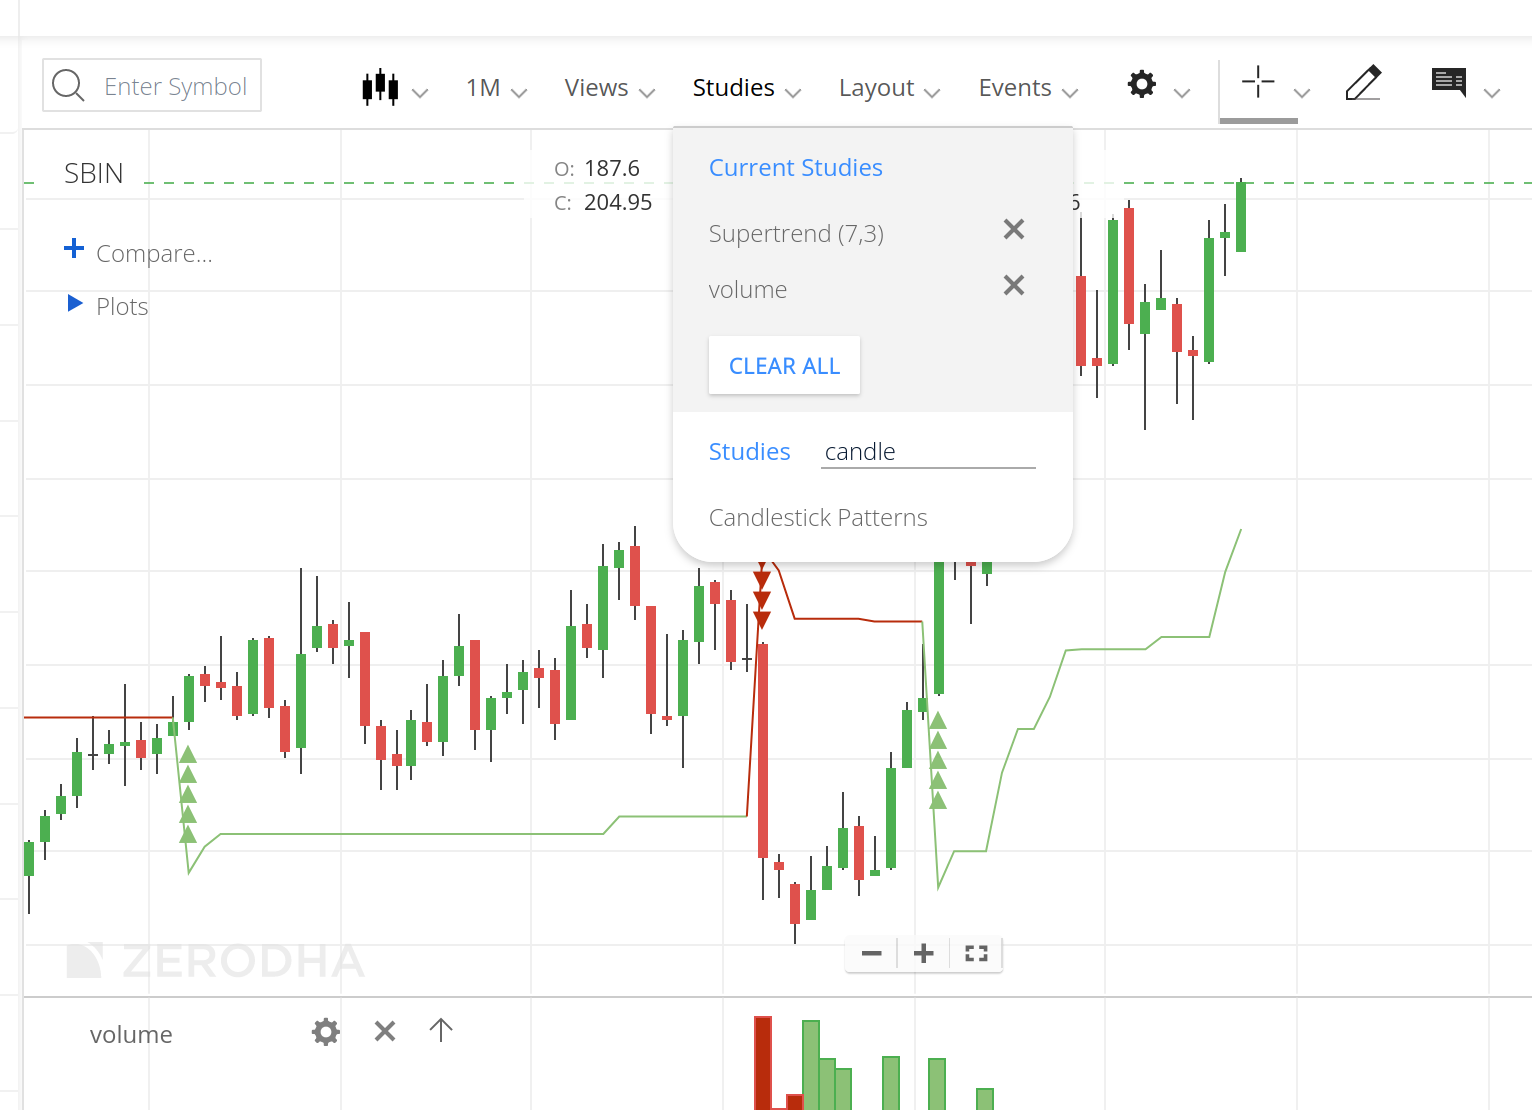
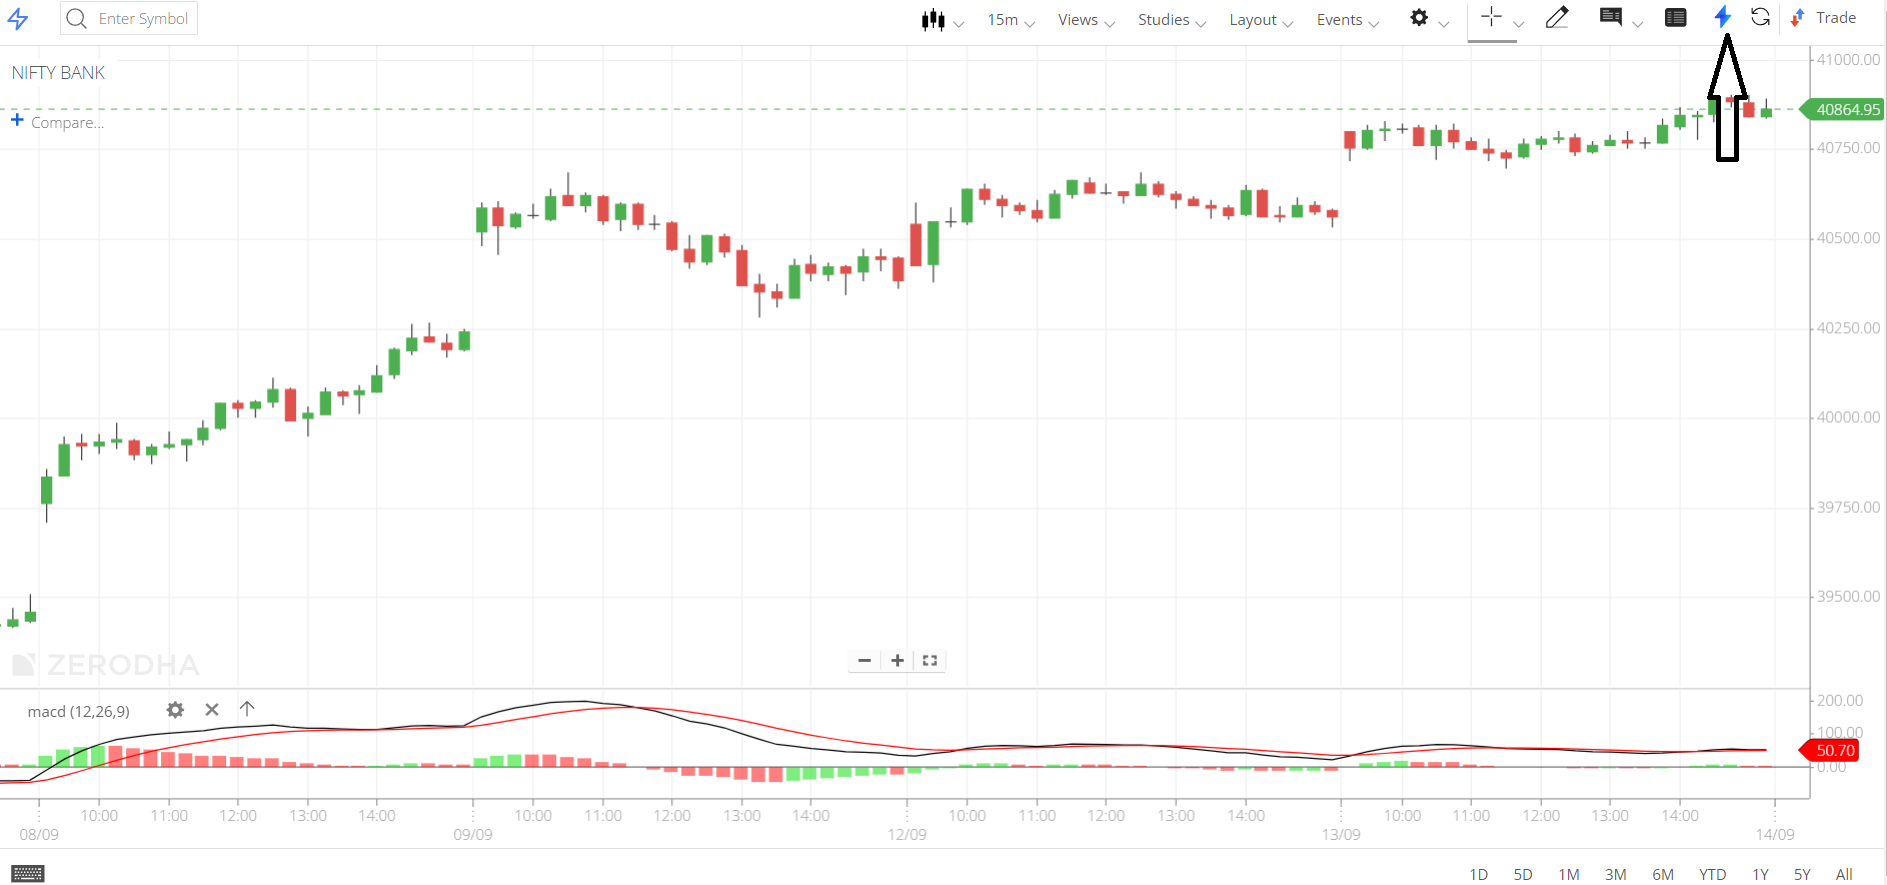
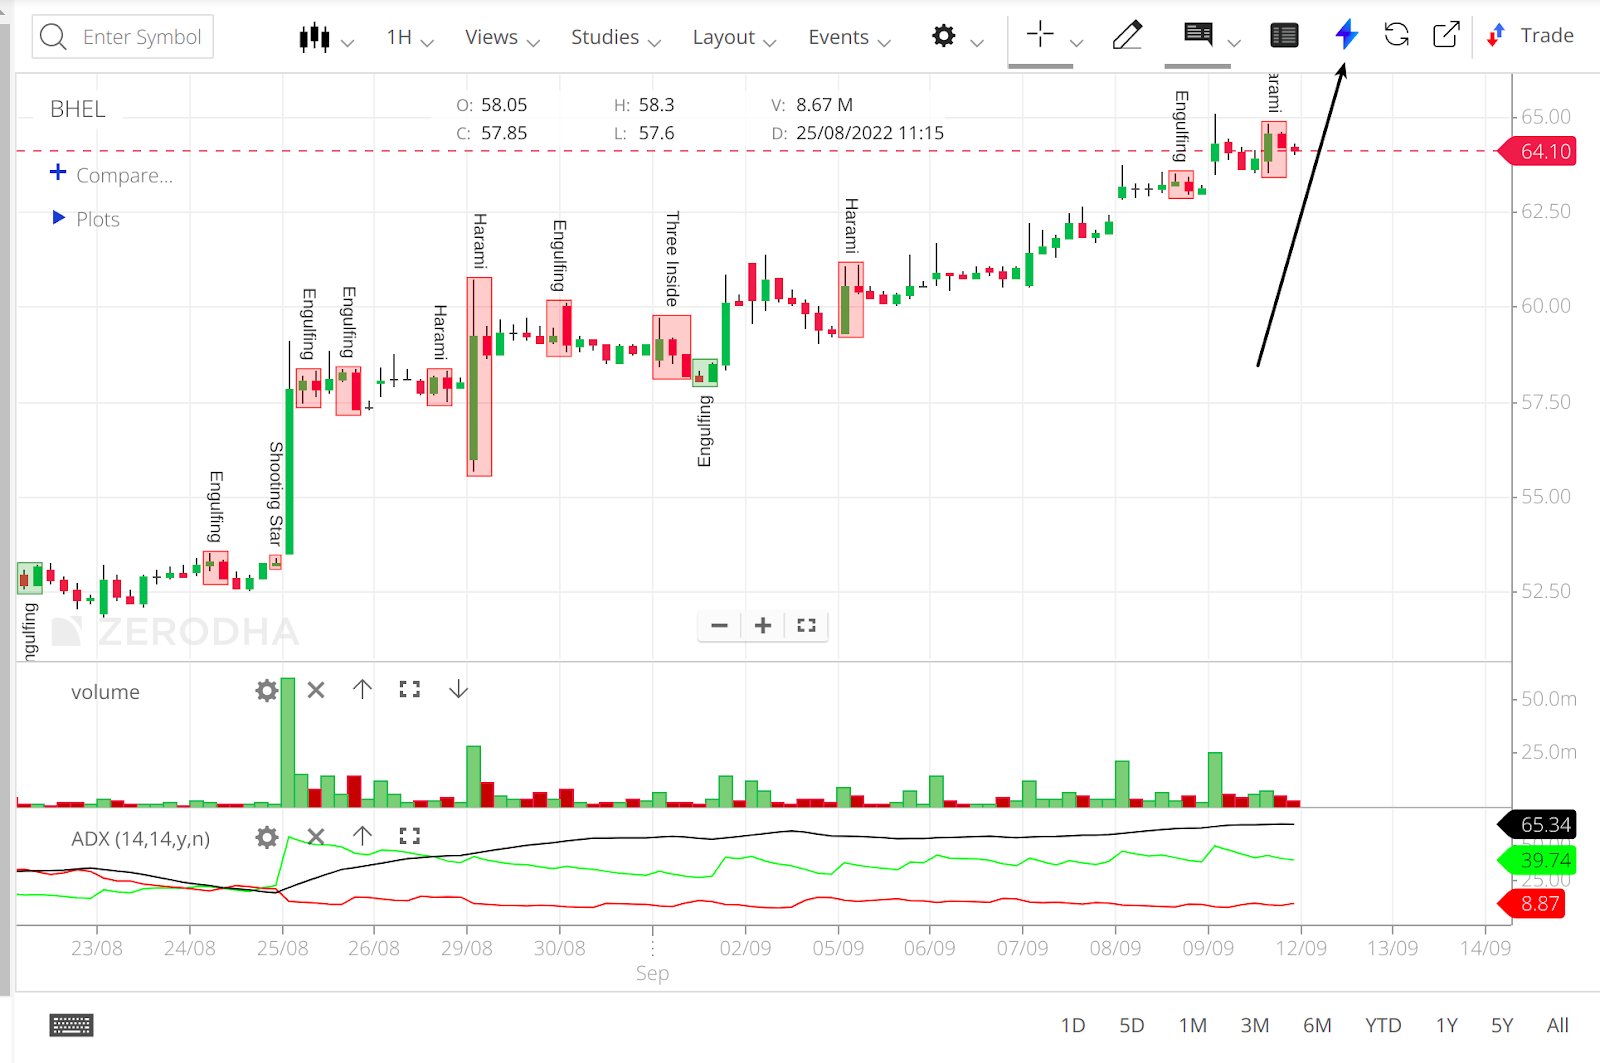
Chart to backtest (powered by Streak): We have a streak button on the chart menu that allows us to run backtests by clicking on it. Backtesting will be performed using the indicators that have been applied. The algorithm selects a widely used strategy and runs a backtest on it. A client may run a maximum of ten free backtests per day. More than ten backtest and edit strategies require a streak subscription.
To learn more about CTB, please refer to this page.
There are so many other improvements to the chart, but I don’t want to make this post any longer than it is already. The most noticeable ones are listed here.
Can I access the previous version of Chartiq?
Yes, clients can access the previous Chartiq, TV, and new Chartiq 8 versions for now. The previous version of Chartiq will be phased out shortly.
Can I use the new chartiq on the app?
No, the new Chartiq option will be added to the app in the next update.
Can I use the views and drawings saved on the previous version chartiq?
Yes, views, drawings, and preferences are synced between previous and current chartiq versions.
Please post any feedback on this update in this thread.