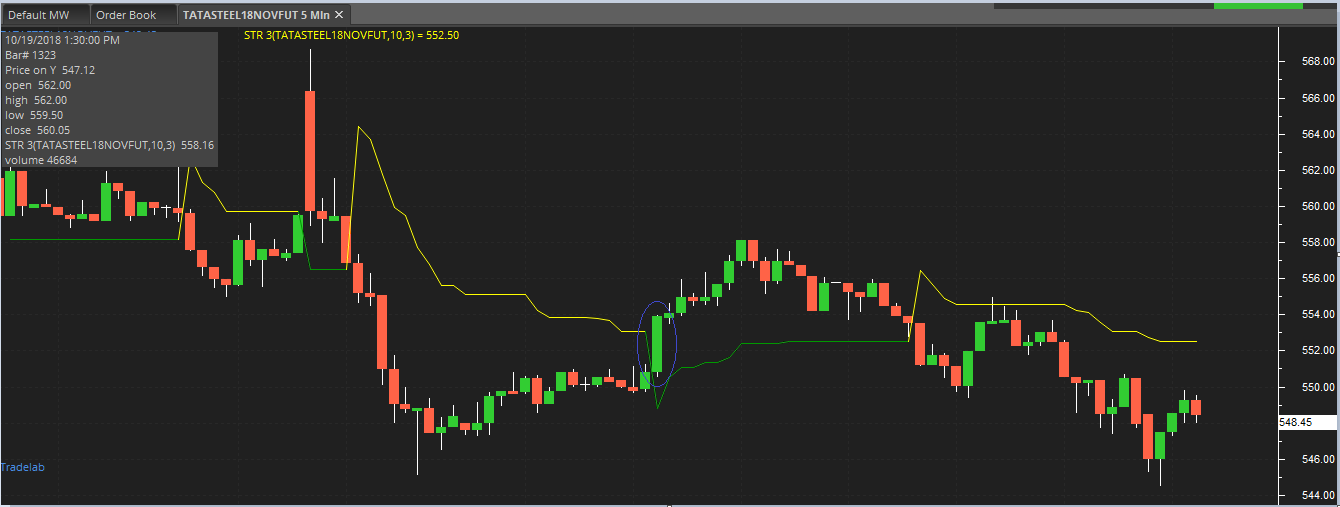
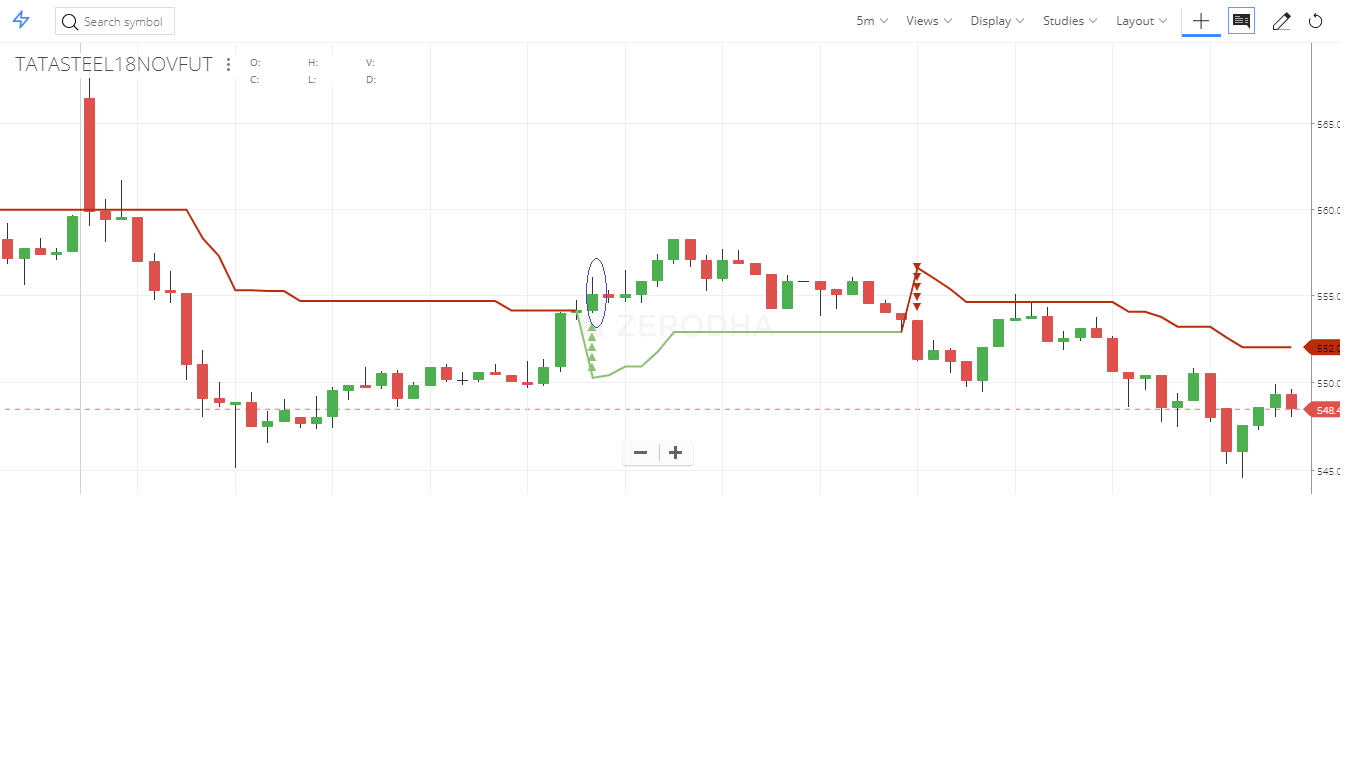
Hi , there is difference between pi and kite charts with supertrend ( 10, 3 ) signals , inserted 2 images showing different buy signals for same Tata steel nov series chart , (5 min ) , which one is correct , can anyone clarify , ( in pi signal comes at long green candle , but in kite signal comes after 2 candles delayed than pi chart , signals shown in blue circles). Thanks.
1 Like
The difference between supertrend values in kite and pi is arising due to a slight difference in the calculation. Let me explain in brief.
The supertrend involves calculation of Average True Range(ATR) . The ATR is a measure of average volatility of an asset price. It was developed by J. Welles Wilder. The ATR is a moving average true ranges of a period of time (generally 14 days). Now there are three different methods to calculate the ATR-
1- Simple moving average method
2- Exponential moving average method
3- Welles Wilder’s method.
The Wilder’s method was described by Welles Wilder in his book “New Concepts in Technical Trading Systems” which actually doesn’t require you to store all the values for previous 14 days. Instead only the previous day ATR value and the current day True range value is enough.
Since the formulas for all the three methods are different, there is a slight difference in ATR values and Supertrend Values also. Different charting platforms use different methods to calculate ATR. Zerodha Pi uses simple average method to calculate ATR while KITE uses Wilders method to calculate ATR. That’s why there is a mismatch in supertrend values in both platforms. I hope now the secret behind the scam is unleashed.
You can checkout out this supertrend excel sheet , which allows you to calculate supertrend and ATR values by all the three methods.
P.S.- The sheet no longer support realtime data, but you can copy paste data manually and check out the calculations.
1 Like