This data traces the evolution of change in household assets in India. Note the stark difference in shares and debentures vs bank deposits.
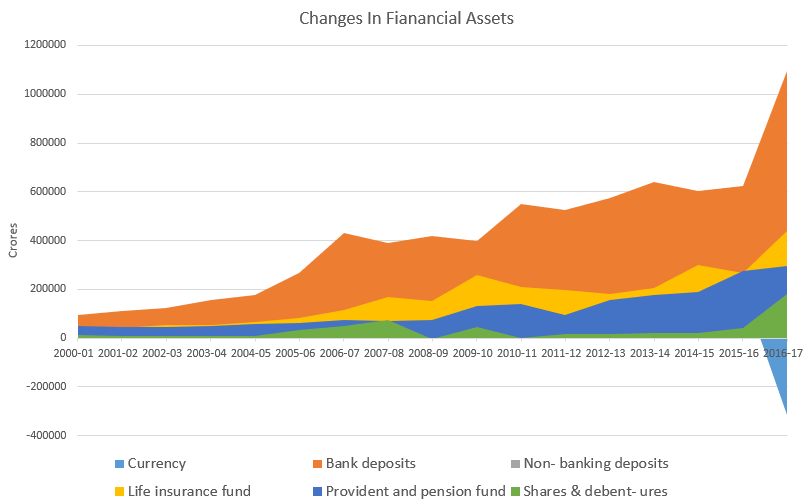
Tabular data
In crores.
| Year | Currency | Bank deposits | Non- banking deposits | Life insurance fund | Provident and pension fund | Shares & debent- ures |
|---|---|---|---|---|---|---|
| 2000-01 | 15632 | 94709 | 3004 | 33861 | 50863 | 11148 |
| 2001-02 | 28156 | 113033 | -347 | 41237 | 44223 | 9834 |
| 2002-03 | 28632 | 122697 | 12496 | 52009 | 45946 | 7123 |
| 2003-04 | 42675 | 155934 | 1945 | 52240 | 48952 | 9078 |
| 2004-05 | 36977 | 175045 | 83 | 67986 | 55794 | 8113 |
| 2005-06 | 52151 | 265716 | 522 | 83494 | 61950 | 33857 |
| 2006-07 | 67194 | 429282 | 4584 | 114851 | 72503 | 50847 |
| 2007-08 | 81278 | 389008 | 1286 | 169848 | 71544 | 74308 |
| 2008-09 | 92188 | 417833 | 14742 | 152861 | 73398 | -2333 |
| 2009-10 | 96940 | 398141 | 18516 | 259821 | 129849 | 44841 |
| 2010-11 | 137131 | 548299 | 5099 | 210102 | 141139 | 1729 |
| 2011-12 | 106242 | 525970 | 10021 | 195673 | 95680 | 16522 |
| 2012-13 | 111521 | 575080 | 27911 | 179949 | 156479 | 17027 |
| 2013-14 | 99520 | 639304 | 22816 | 204469 | 177841 | 18930 |
| 2014-15 | 133345 | 602727 | 33524 | 299296 | 188777 | 19819 |
| 2015-16 | 200518 | 622094 | 36655 | 266063 | 276854 | 41317 |
| 2016-17 | -316812 | 1095771 | 34142 | 440653 | 296078 | 182578 |
| Source: RBI |