I try to find historical charts of expired derivative scripts from half of year but I realize that It is impossible to Got those charts because they were not exist after expiry . For ask question on that , I just join Trading QnA . Please provide me website or software , in which I can got historical charts of expired derivatives .
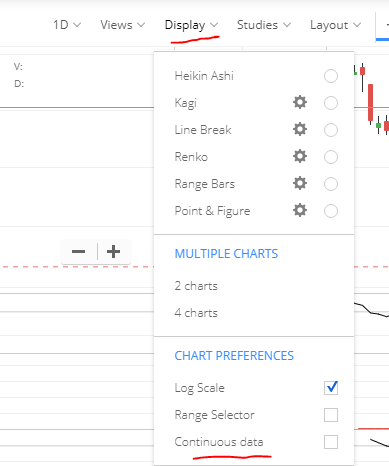
For futures, continuous daily data s available on kite. Open any futures contract, go to display and select continuous as shown below.
4 Likes
But Data is available for 1 Day Candles Only , I want Minute candle Data How to view it ?
You can check with some data vendors like true data or Global data feeds.
Their Price of data is separate than software and Software is different , with come with high price …And Varies to TimeFrame Data . And All Data is not present , that I want .
Thanks for Providing Knowledge …
I have it .
I will Explain what I have within few time .
@siva-reddy would this work with derivatives of all asset classes? All Currency and commodity derivatives too?
1 Like
Which one?
For futures, continuous daily data s available on kite. Open any futures contract, go to display and select continuous as shown below.
Would continuous data be displayed for futures contract of all asset classes? equity, currency, index, commodity?
1 Like
For all except currencies on kite.
When ?
Now .
Hi , I have all that you want . I have historical and original charts of Expired Equity derivatives and Commodity derivatives contracts , from First trade to last trade of particular contracts .30 working Days Data before expiry of contract is possible to see with that charts . 1 minute candle charts and Tick charts ( 0 minute charts , means LTP and volume per second is plot on chart ) . Following are details of it .
1. How I have it ? ---- When I contact with derivative contracts , I find that Charts were deleted after expiry of contract , so unable to view those data because it get deleted from Brokers server . Then I start to save Data on my other Broker software , which I used for watchlist , For trade I use Zerodha at that time . So , I start to save those charts from July 2017 .
2. Which Charts I have ? ---- 1Minute candles
NSE Equity stocks shares cash + Their futures of every month
NFO Nifty , Banknifty Indices Indexes cash ( Nifty , Banknifty ) +their Futures + their Options all strike prices of all expiries ( Weekly + Monthly )
Commodity - MCX + NCDEX Every Expired contracts charts
---- 0 Minute charts known as tick charts ( 0 minute charts , means LTP and volume per second is plot on chart )
Purely Intraday Charts with Plotting LTP and volume per second , First to last trade .
NSE Equity Cash + Futures Who show more than 2 % movement in single day . Nifty top 10 + Banknifty Top 15 + In news stocks + their futures Every day compulsory saved charts .
Nifty , Banknifty Futures + Options Every strike price + Indices ( Every second tick ) Senseex also .
MCX - Crudeoil , Gold , Goldm , Silver , Silverm , Silvermic charts from January 2018 .
3. Use of this data -
Any chart , any date from past can view.
Volatility at starting minutes and ending minutes can view second by second .
Deals after 3.30 PM can view in stocks .
How much time stock / Index /Derivatives can hold their high / low view simply .
News effects and volume playing .
Compare cash charts with their Futures and Options ( in case of Index cash ) .
Analyse multiple charts up to 10 at a time is possible with that software .
Charts are present in real form , not in form of Screenshot , pdf or Image .
Apply any indicator .
Specially for Index options of Every strike prices , Compare cash + Futures + Options .
4. Who have that type of Data ? Few Data vendors have that type of Data , but not in complete form . Their charges are heavy and They charge diferent for their software . I have it , because I saved it at every expiry and every day also . I done little Hardwork for that .
I dont need to tell to professional people that How use this data , because they already know how to use and value of this data . Many people wants to grow in numbers and Happiness without complete learning but only few wants to learn and Grow because they know without learning growth and Happiness is not possible . I hear from experts - people like to do loss in trading than Learning because they think they will learn after earn …
If anyone want that type pf charts please email to [email protected] [email protected] Happy Learning …
Yes, I have inquired about this 1 min and tick data in various authorized data vendor and the price as below.
- GFDL- has 1 min FnO and the price start around 17.7k including GST per year
- TryeData- has 1 FnO and price start around 17k including GST per year
- Ticker plant - 1 min FnO price starts around 20k including GST per year
- Accelpix- 1 min FnO and the price start around 15k including GST per year - Lowest Price
- Spider - Not providing any row data
So you can check and purchase after checking the sample data. Above all sources are NSE authorized so you can trust.
2 Likes
In which Software that Data can open ? and What is cost of software ?
Hi Pratiraj , I mailed to your 2 mails , Please check .I want those data , because I know its value and value of learning also . I try to find it from past 15 months at low cost . I hope you will provide me that data and help me to learn fast .
you will get in CSV or TXT format which you can load in any software.
Which software you are using as of now ?