Introducing Performance curve on Console

Keeping track of your overall trading or investing performance across segments like equity delivery, intraday, or F&O can be difficult, especially if you want to compare your performance against benchmark indices or different asset classes. To help with this, we’ve introduced Performance Curve on Console.

Unlike the current account value curve—which fluctuates when you add or withdraw funds from your account, the performance curve focuses on actual account level P&L and provides a clearer picture of your trading performance by including both realised and unrealised profits and losses.

How is the Performance curve generated?

We start with a base NAV (Net Asset Value) of ₹1000 from January 2020 or from the date your account value crosses ₹1000, whichever comes first. Each day, the performance curve updates based on:

  • Profits or losses from trading (realized P&L).
  • Changes in the value of your holdings (unrealized P&L).

To ensure there are no sudden fluctuations when you add funds to your account, we create units using the previous day’s NAV to keep the curve smooth. Likewise, when you withdraw funds from the account, we reduce the units to avoid sudden dips.

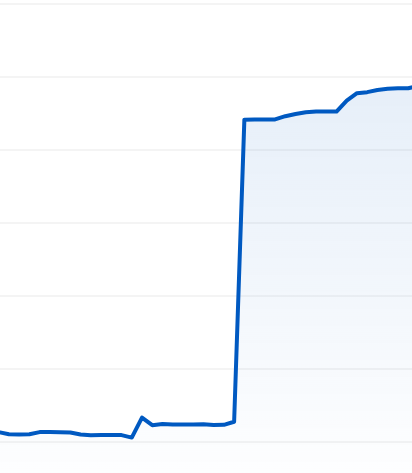
Let’s say your account value is ₹10,000. If you add ₹5,000 to your trading account the next day, the regular account value chart will show a 50% jump as the value increases to ₹15,000. But this isn’t actual profit—it’s just the added funds.

In the performance curve, for the same scenario, if your account value is ₹10,000 and the NAV is ₹1,000, you’ll have 10 units (10,000 ÷ 1,000). When you add ₹5,000, we’ll create 5 new units based on the previous day’s NAV (5,000 ÷ 1,000). The total units will be 15, and the NAV will remain ₹1,000 (15,000 ÷ 15), since no profit or loss has been made.

We have also set rules to handle corporate actions such as bonuses, stock splits, IPOs, etc., to ensure the account value is accurate and there are no unusual spikes or drops.

What’s next?

The performance curve is currently in beta, and we will soon be adding basic benchmark charts to make it easy to compare performance against relevant benchmarks, such as the Nifty 50 index.

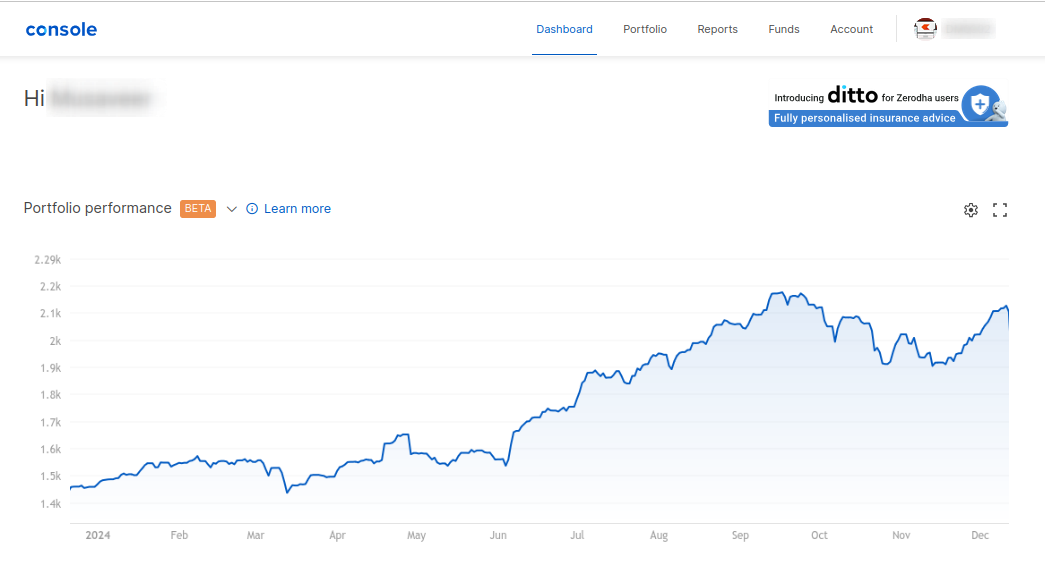
You can view the Performance Curve on the Console dashboard. Click the drop-down arrow next to ‘Equity value curve’ and select ‘Portfolio Performance’

Note: Currently, the curve is in beta, so there might be some issues. We’re working on fixing them and will announce it to a larger audience soon. If you spot any issues or have feedback, please create a ticket here.

22 Likes

Would be nice to add some basic stats based on that too. % returns / max Drawdown / Drawdown graph etc.

6 Likes

Most awaited feature for me. Took quite some time.
But I don’t think any other platform has any similar feature. So good work.

I have around 75% in mutual funds and I pledge those funds to sell options. So my account fluctuates due to two things - mutual funds/niftybees as well as trading fno. Thus I would like to see drawdown data as well as the ability to deselect mutual funds/equity. This way I will be able to see the complete graph as well graph of trading performance only.

2 Likes

Can we get the point-to-point % gain/loss as we see in Google charts?
Can we get a similar curve for smallcase?

This is great. Very useful feature to unitize the whole porfolio!

FYI I am seeing a huge jump in the curve around the time I was gifted a few stocks. Maybe you can factor that in as a “fund addition” too, to prevent huge jumps.
image

Most awaited. Now I am asking a little too much from the team.
Can we get this for family accounts too. :stuck_out_tongue_closed_eyes::stuck_out_tongue_closed_eyes:

I may have equity in one account and I sell futures in other account sometimes. :rofl::rofl:

Hey, we are currently working on implementing stock-transfer handling. This will be included in our upcoming updates.

@SpacemanSpiff @emrys11 @VED_PRAKASH_YADAV we’re working on adding some useful analytics around performance curve, we’ll keep you updated.

3 Likes

@TheGouda how your portfolio performance graph is using

its take only mutual fund and equity segment to track performance or FNO activities also ,
please explain - i need only MF and EQUITY holding performance - and please give the option to use this

Currently, the performance curve is taken into account for all segments. We’ll see if we can provide it segment-wise.

2 Likes

Segment wise only Useful , then only we will come to know which one is performing which segment is not

2 Likes

Right :+1: Please @TheGouda consider this request

1 Like

this :slight_smile:

The performance curve is extremely complex to build, considering so many edge cases to cover. We’ve added many checks and balances to ensure they show the most accurate performance across the account. It is difficult to split it into segments, so our top priority is getting the account-level curve right with basic analytics. After that, we’ll visit segment-wise, family-wise, etc.

2 Likes

Why is it so slow to update. It is December 29th and my portfolio performance is only updated till 25th. Will this be fixed soon or it will remain that way? 1 day lag is fine but 3-4 days is a lot.

Hi,

Is the NAV adjusted for IPOs & Buybacks-

  1. Are new units created after IPO allotment
  2. Are units redeemed after Buyback

TIA

Rushabh

This will soon be T-1.

Yes, we create units for IPO investment value based on the previous day’s NAV, whereas we redeem units for successful buyback amount.

1 Like

Is it possible to consider dividends too?

1 Like

Dividends are not considered in the existing version of the curve, we’ll see if it can be included.

2 Likes