@Ruchi_Porwal @TheGouda in my case there has been
NO withdrawal/No Qtry settlement
NO large position closure or rollover
my Portfolio NAV has dropped to 0 on 23rd Dec. sent client id via DM.
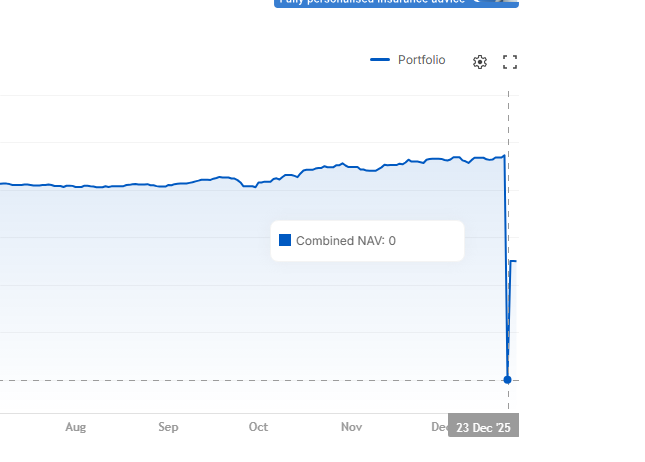
why this behavior?
@Ruchi_Porwal @TheGouda in my case there has been
NO withdrawal/No Qtry settlement
NO large position closure or rollover
my Portfolio NAV has dropped to 0 on 23rd Dec. sent client id via DM.
why this behavior?
Hi @loke4300
This seems doesn’t seem to have affected all. We’ll check the drop shown in your case. We haven’t received your client ID on DM yet. Will wait for it.
@Ruchi_Porwal the drop is still visible in console dashboard. tagged you again in the DM sent. pl check. this affects the entire curve which sadly is the only visible option to check portfolio growth.
by when xirr will get added
@loke4300 The drop shown on your performance curve should be resolved now. It occurred while curve computations were running over the weekend and may have coincided with a login at your end during that period.
Thanks @Ruchi_Porwal the curve looks good now. Will ignore weekend spikes on curve if they happen again.
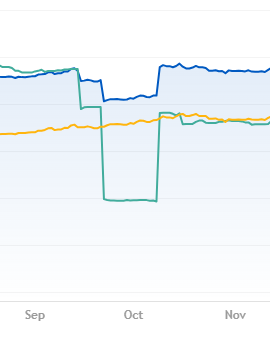
Thanks for the curve fixes. But some small issues are still there. In mine some back dated transfers to/ from secodnary demat brought in big slumps in it. Would be great if it can be fixed.
Hi @zoomtrader
We’ve added fixes for secondary transfers on the curve. We’ll check your case and let you know once it’s fixed.
Hi @Ruchi_Porwal , can you tell me why i am able to see different holding details in console dashboard holdings and coin app, always amount is mismatch is there, any batch will run at different timings ???
Hi @Ashwin1
The reason for the mismatch in current values between Console and Coin is explained in this support article. If you still have any doubts specific to your account, you can DM us with the details and we shall assist you further.
hi @nithin @TheGouda @Ruchi_Porwal
This is a great feature and i am really happy with zerodha for adding this.
I have a request - can you add drawdown % feature in the graphs itself. like as we hovering and moving our cursor, and it is below the equity peak, it should show -2% or -5% from the previous peak.
Edit
Also request you to add S&P 500 INR in the comparison options. I have almost 50% in that fund and i would like an option to compare to that too besides Indian indices.
Hi @Moriarty
We’re adding various portfolio metrics, including drawdown, on top of the performance curve. We’ll soon begin with the testing phase. We’ll update once it’s live.
We’re considering expanding the comparison list. It’s on our to-do.
Any update? I can still see a big jump around stock transfer/gift timeline.
Can we give read only access of console to CA.
Reports and statements only.
There’s no such thing as “View only” access. Console backoffice requires Kite trading terminal credentials to view/download critical data/reports. We suggest you download and share the necessary reports, but do not share account credentials with anyone.
@Ruchi_Porwal More than 1.5 years have passed. Any update on the “next in line” support for stock handling?