Thanks for the feedback, we’ll review and take a call.
Hi, even now the curve does not handle the process of gifting stocks.
1 Like
Hi @tallerballer
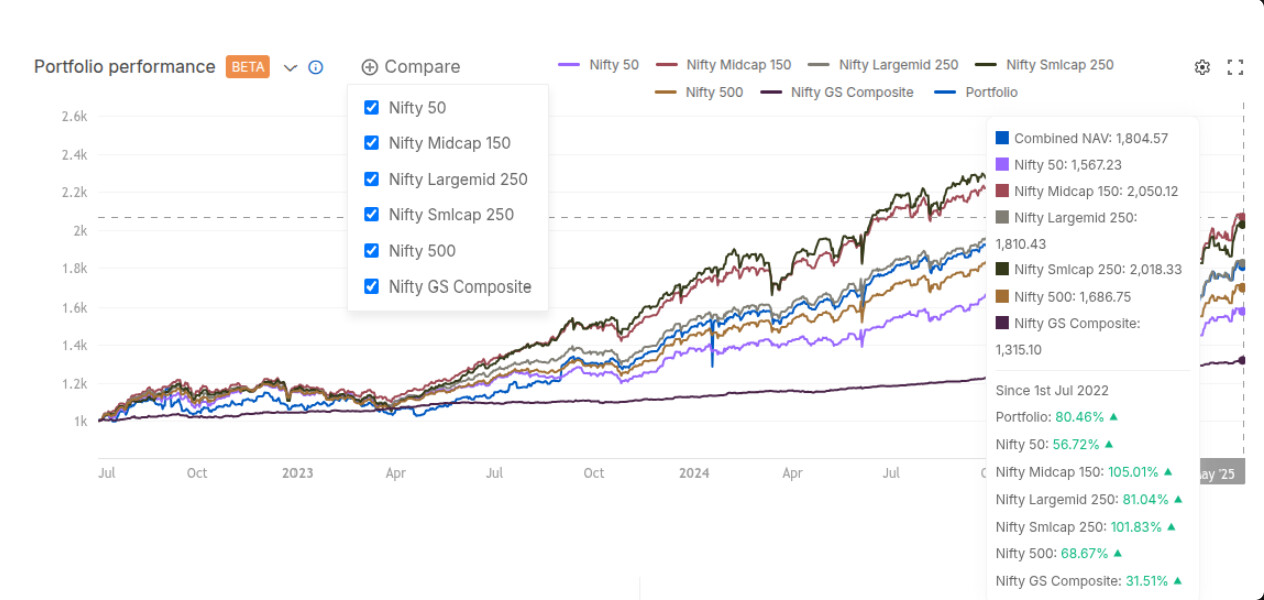
We just went live with a new update where we’ve added more benchmarks to compare your portfolio against. Stock transfer handling is next in line, as this requires some workaround.
5 Likes
@siva @TheGouda @Ruchi_Porwal
I would like to request a feature enhancement for the performance curve . It would be great to have:
- A custom date range option to analyze performance over specific periods.
- A time interval menu with options like 1M, 3M, 6M, YTD, 1Yr, 3Yr, 5Yr, and Max.
You can zoom in/out or move graph horizontally to adjust time period. We’ll review providing time period options. Thanks for the feedback.
Any update?
Hey @tallerballer
We are taking a bunch of internal updates for the performance curve live in the coming days. This will go live along with it.
2 Likes
Hi team,
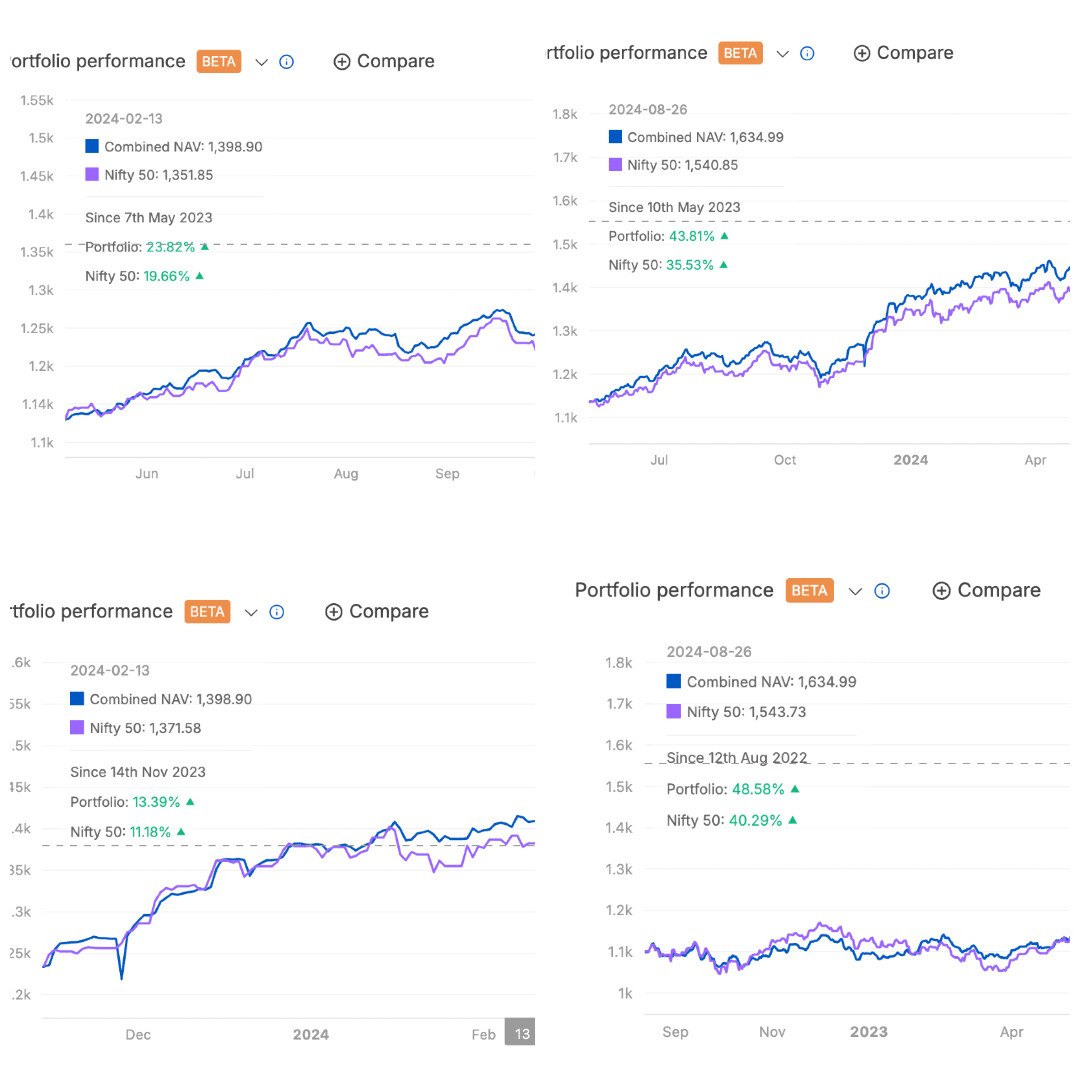
When I see across different time frames, the NAV value of the portfolio remains same in absolute terms (which is expected) but the benchmark NAV value changes.
Attaching the screenshot of 2 random dates when viewed in different time frames for reference.
Hi @Harshit_Gupta
We are unable to reproduce the issue that you have mentioned. If you could DM us your user ID, we can get in touch with you to get more details and identify the problem.
Hi Team,
Just an issue I had a few corporate bonds in my portfolio, and they got redeemed on maturity, which messed up the console graphs. How are bond maturities processed for these NAV Curves?
Hi Chetan, bond maturities are currently not handled on the curve. It’s on our list of further updates.
Oh okay so if I had a portfolio of say 1L and 10k bonds matured what happens to equity curve does it drop sharply since the value of the assets remaining is 90k only??
As of now, yes, you’ll see a drop in the curve. We’ll keep you updated once this is taken care of.
When I transfer stocks to my secondary demat in Zerodha, the performance curve breaks. Is this a known issue?
Is this broken? I see a huge swing down on the curve
I have dm’ed you my id. Could you please check?
The abnormal spike seen on the performance curve in your case is due to a known system behavior, which is a result of payout and a ledger credit on the same day. We are testing a possible solution as we speak. We’ll be going live with it, along with a bunch of other improvements next week.
1 Like
Ohk thanks