Agreed @Chirayu08… I have a strategy on Nifty Bank and Nifty 50 stocks, so I also check how the sector is performing before taking a trade. I was going on the NSE site to view the data but here the heat map gives an overall picture of the sector. So job made easy I’d say.
Is it free or do I need to pay to use this?
Great job guys this is much use full. I literally trade on Volume breakout stocks every day its nice that all time frame all segment volume breakout is there in one place.
Looks like it’s free for public use. I dont see any pricing on the website.
Took the help of the options analytics (volume breakouts) for today’s paper trade and the decision turned out to be good.
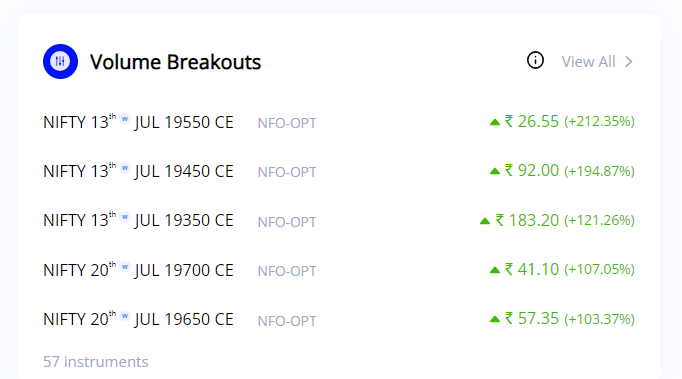
Really good and helpful product
This is free to use.
absolutely free!!
This product is awesome🔥
Lets say the BNF heatmap is all green it makes sense to buy BNF ?? Any expert advice ?
Hope to see the integration with Kite page soon that will make it easy.
Makes Sense bro.
Not a expert though
The data is updated every 5 minutes.
i dont think any other platform provides instant breadth analysis for multiple timeframes. This will be helpful for swing trades ; Thanks Zerodha and Streak!
For example: I was wondering nifty is at ATH again, should i enter or not. But on hourly timeframe as of now, trend is slightly bullish. but the market breadth is negative! so need to be cautious. will not be entering as of now, unless i see additionally confirmation or the breadth improves.
When is Nifty and Bank nifty weekly options expected
Cool. Does this show for all stocks?
Awesome!
Woah!! @zerodha @Streak
The synergies of Zerodha and Streak have always been awesome.
Last year CTB Chart to backtest and now they have dropped this Technical Dashboard too!!
This is truly impressive! Having access to extensive stock market options data can greatly improve trading strategies.
Thanks for your constant innovation and collaboration.