Our focus at Zerodha has been to help you do better with your money. That means giving traders and investors the best tools possible to help them make informed decisions. As a strategic decision, instead of building everything, we’ve partnered with some of the best teams working on solving these problems. Smallcase, Sensibull and Streak were the result of these partnerships. These companies today have built the best in class tools for fundamentals, technicals and F&O.
About Tijori Finance
One of the newer companies we’ve partnered with is Tijori. It’s an investment research platform for all things fundamentals. They’ve built an amazing platform for fundamental research and you will soon see more tools powered by them across Zerodha platforms. From speaking to customers over the years, one of the pain points they had highlighted is the lack of a single place to track all the events and developments that can affect a company.
New features on Console
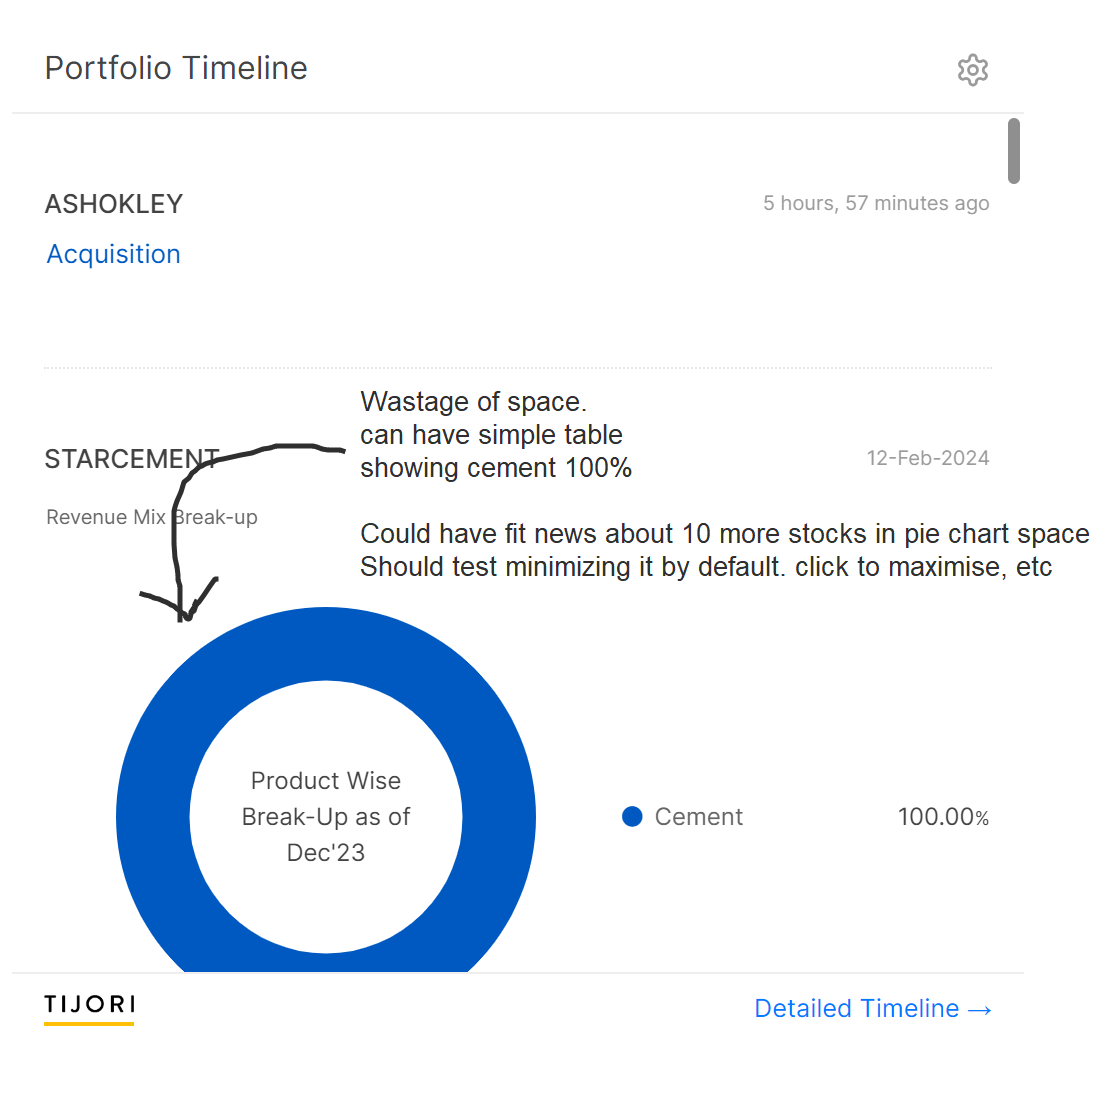
Timeline
You can view Timeline on the dashboard of Console. Think of it as a social media feed, but only with updates about the stocks you hold.
Stock insights
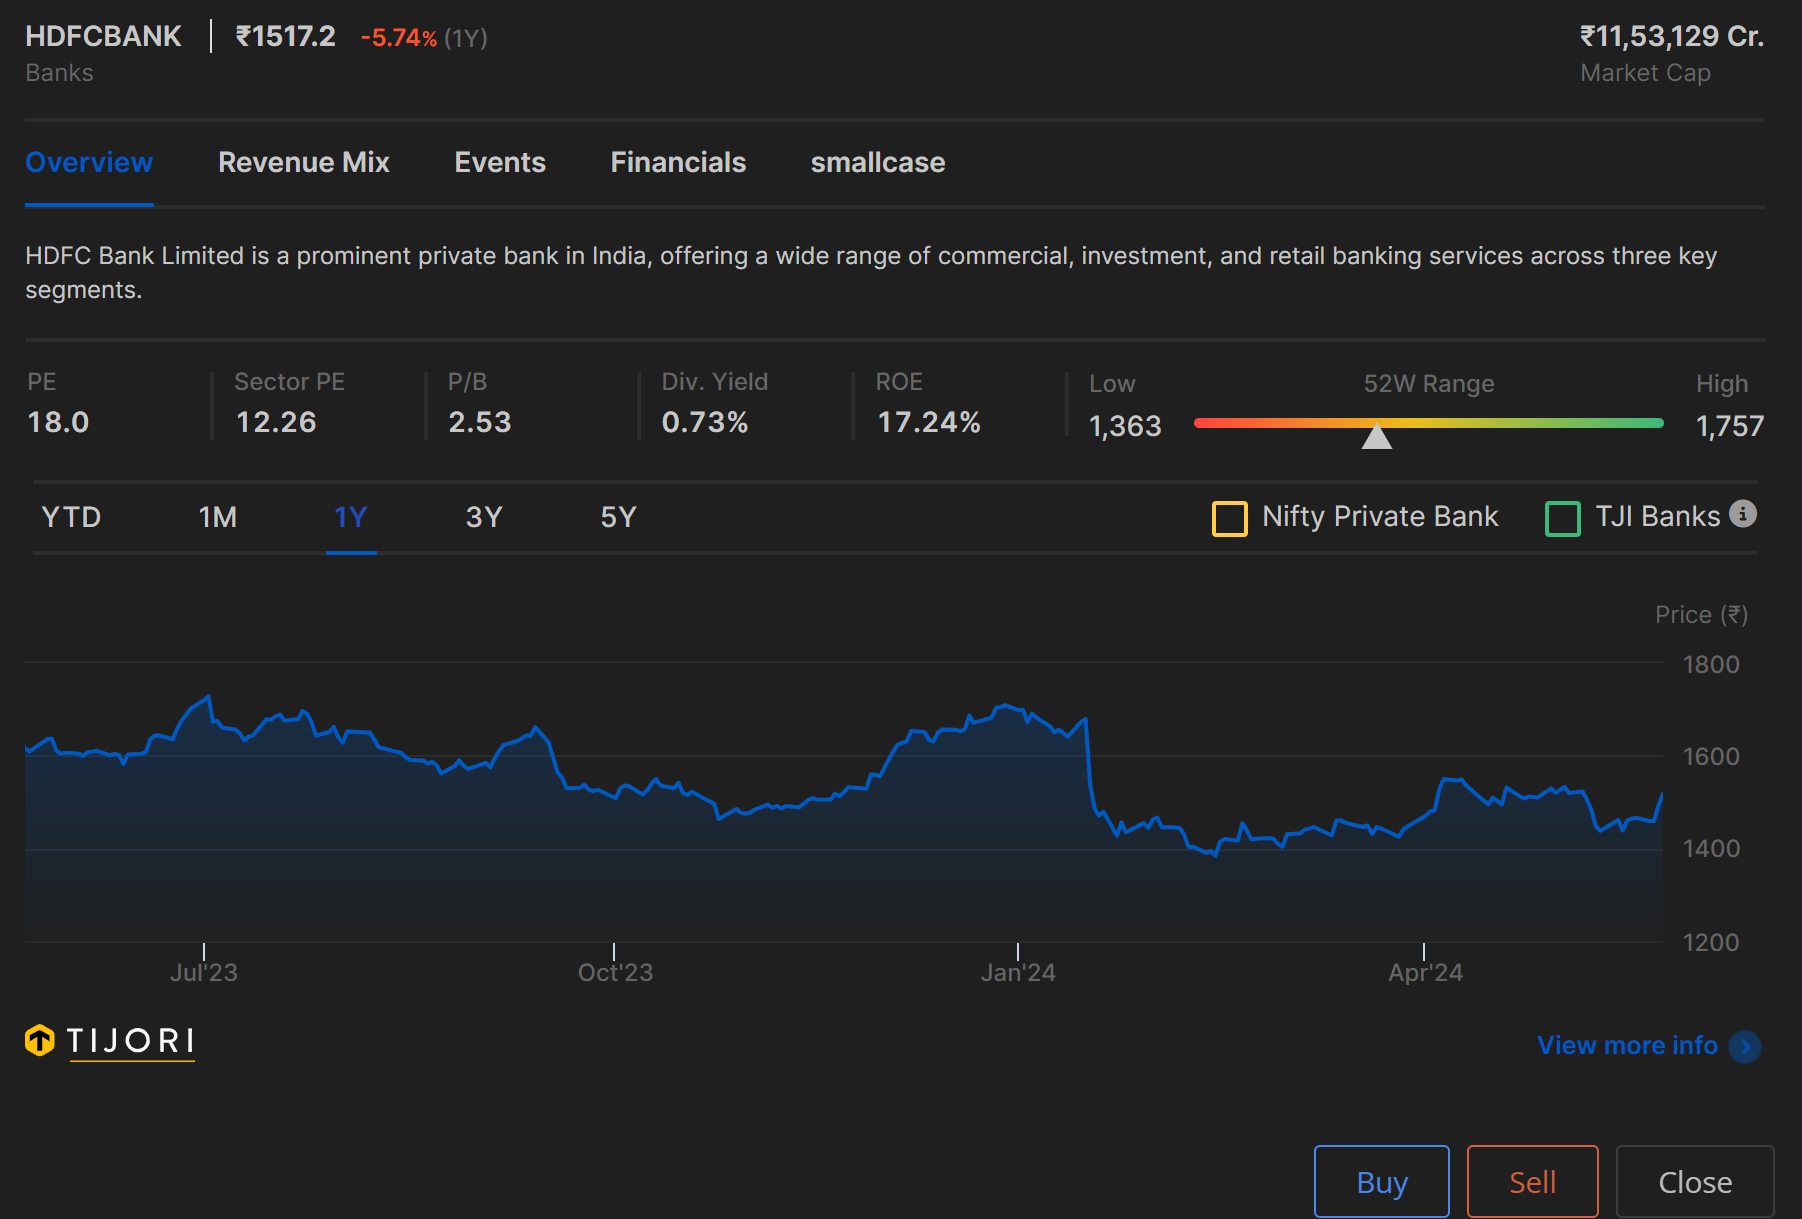
The Stock Insights widget gives you a bird’s eye view of the fundamentals of a company in your portfolio like
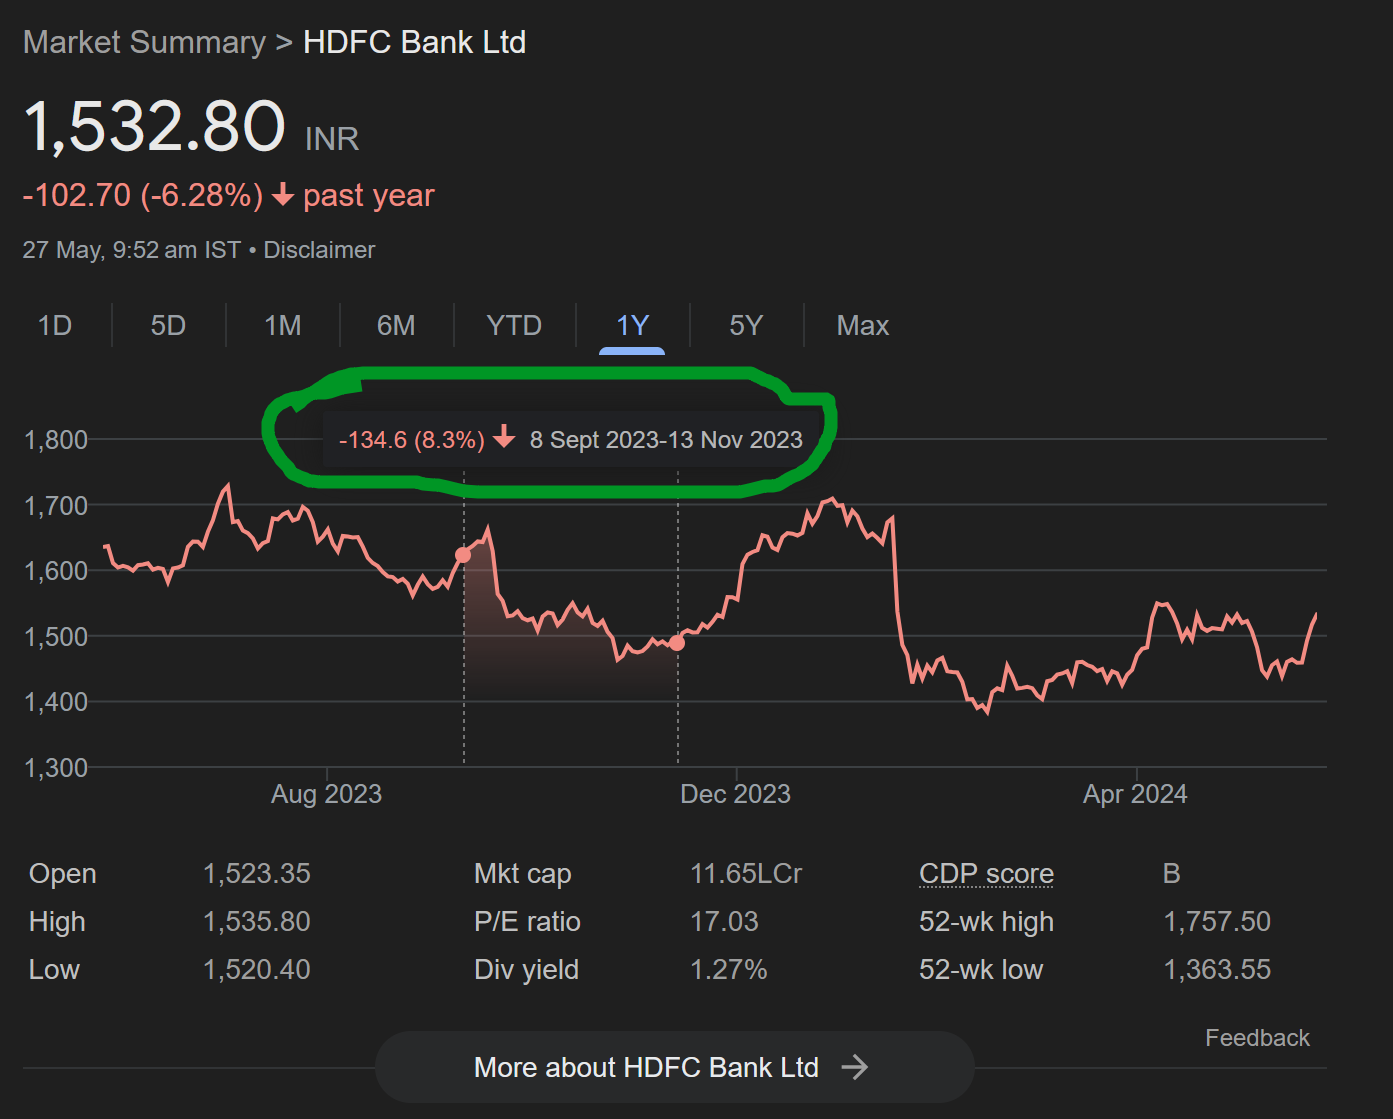
Overview of stock price performance over 1-month, year-to-date, 1-year, 3-year, and 5-year periods, including comparison with the sectoral index and a custom index by Tijori Finance.
Financial Ratios: Important financial ratios like Price to Earnings, Price to Book, EBITDA/EV, and Dividend Yield over 1-year and 3-year periods.
Forensics insights on the financial health of the company. These insights are customized based on the sectors that a company is operating in like banking, insurance etc.
To access Stock Insights, log in to console.zerodha.com, go to Portfolio > Holdings, click on Options, and then select View Insights.
Some of the other updates you will see on Console like:
Exchange filings by the company, such as annual reports and outcomes of board meetings, updated minutes after filing with the exchanges.
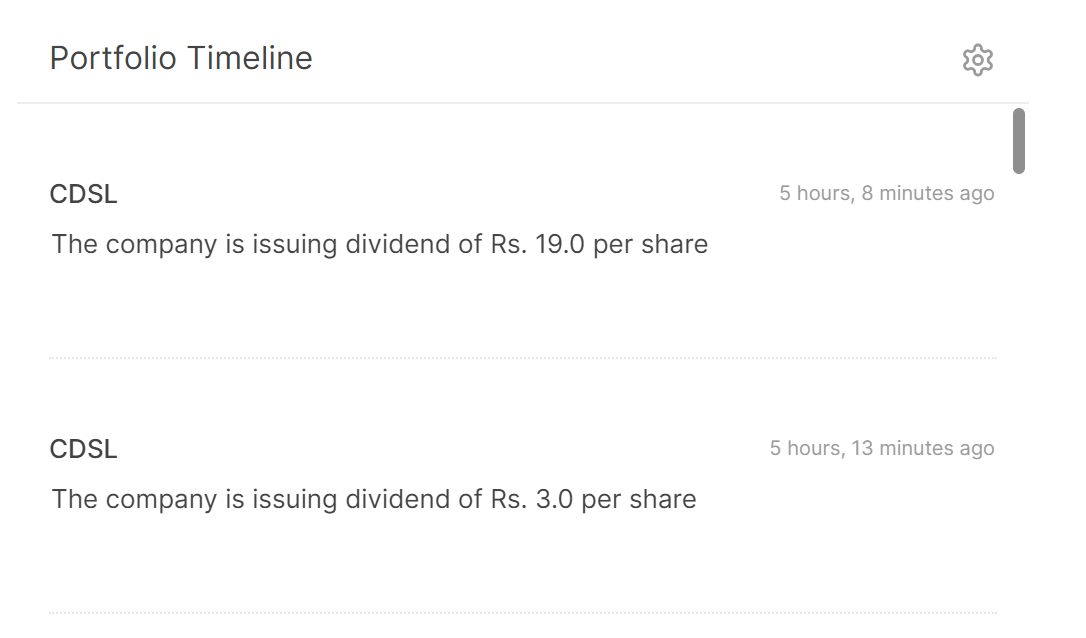
Corporate action updates, like dividends, bonuses, stock splits, buybacks, etc., for the companies you hold.
Quarterly results and shareholding updates with quarter-on-quarter and year-on-year percentage changes.
Updates on the company’s net debt and capital expenditure.
Do check out our Z-connect post and YT video to learn more about all the features:
Any possibilities of integrating it in Kite, with which you can view the portfolio timeline at the click of a button. Like how the button click for TPIN, analytics, family, etc is placed
Hi meher,
I have an issue with tijori, its only considering the holdings which are not pledged. Because of this many of my stocks are not reflecting in tijori, is it possible to check on this?
We’ve made many back-end changes to accommodate a longer period curve to support our scale. Hence, the new design also the account value curve is now available in the mobile version. Similarly, we’ll have equity curve for 3 years. We’ll update once it is live for beta testing users.
A) The bifurcation of amounts (between Equity holdings and MF) shown for the current date when you move the cursor on the “Equity Account Value curve” does not match with the bifurcation of amounts shown in the “Equity Account Value table” which is present just below the curve. While the total matches (Equity + MF) of Curve = (Equity + MF + Pledged holdings) of table, the individual amounts don’t. You might want to consider same set of values / definitions for both the curve and the table so that people don’t get confused about changing amounts between the table and the curve.
B) The “equity holdings” value shown in the curve is definitely incorrect for me if I am considering only equity shares held in my demat. The “equity holdings” value shown in the table seems to be right. And the difference between both the figures is approx 6X (curve shows a 6x figure while table shows x).
Pledged holdings has been fixed from our end. Next time you sync your holdings from kite all your holdings (including pledged should show up in your portfolio).
Request you to re-sync your holdings on Tijori & drop us a note at [email protected] in case the problem still persists.
Family holdings don’t show up (asks for a premium subscription) I believe you can extend this from connected zerodha accounts, shouldn’t be much of a issue?
if possible please work on the UI wherever you have cards highlighted like this, White text on yellow is certainly not readable, puts a lot of strain on the eye
Some of the features are still limited viz, reverse dcf, in depth research, Ops metrics, any forecast Financials of the companies / sectors prediction, historical data. Will this be integrated afterwards?
Typically the data is pushed to the timeline within a few minutes after the exchanges release the data. We will review it internally & check if there was any delay here.