If the price and volume go up then the volume is considered a buy vol. Likewise, if price comes down, and vol increases it is considered a sell volume.
6 Likes
There are few indicators that make use of buy volume and sell volume. Accumulation/distribution, Money flow index , on balance volume, Price Volume Trend are few indicators that make use of volume data.
3 Likes
“hi… I want to track for each candle in a given time frame, what is the buy volume and what is the sell volume as available in the terminal” <<
Unfortunately, there is no such indicator available.
Volume is only taken as the total for transactions that have taken place.
You might need to write yourself a program to fetch details from NSEINDIDA (Web Crawler) for specific scrips that you want to track from Order Book data… but I think they give only top 5 Buy and Sell orders.
Not sure if such information is made available by data providers and corresponding indicators exists.
I am sorry, didn’t understand your question. Could you elaborate on what you want to track?
hi… I want to track for each candle in a given time frame, what is the buy volume and what is the sell volume as available in the terminal
@sats
For each candle there is one volume data. This volume data = No.of shares bought = No of shares sold.
So the total buy volume and the total sell volume and the total volume are all same.
You should understand the fact that for every seller there is a corresponding buyer for the trade to take place.
1 Like
can u explain deeply, need sell volume & buy volume crossover, where we can get this crossover
(1) You can use Volume Profile
tradingview.com has this indicator (which is paid)
Even Zerodha has Volume Profile but does not give details in diff colors RED and Green
(2) You can also use OBV also
OBV is calculated by adding daily buy and sell Volumes
@poorna_chandar @keerthideepa @RB0623
Guys… Guys …Wait a minute… (or girls) what do u mean by sell or buy volume. For a trade (volume) to take place there has to be a buyer and a seller. Volumes are given colour depending upon the price movements for the particular time period which is available in volume panel of any charting tool.
Hmm…Am I still missing something here?
@keerthideepa @RB0623
yeah same time both(sell and buy) happen, but, to know long buy going or short, in another way also want to know, how many open and close contract on open interest. OI will transparently show the market going. any crossover ?, or coding ?
Yes. I think new contract created and squared off contract in the open interest could be helpful.
I think the volume for the day and open interest could offer some clue. For example, volume (of futures) was high and open interest reduced basically means traders squared off position, volume is high and open interest increased basically mean on net basis new contracts were added. But problem is open interest on real time basis is tricky and EOD data is too late to be useful for trade.
1 Like
so no option for crossover
thanks for your reply
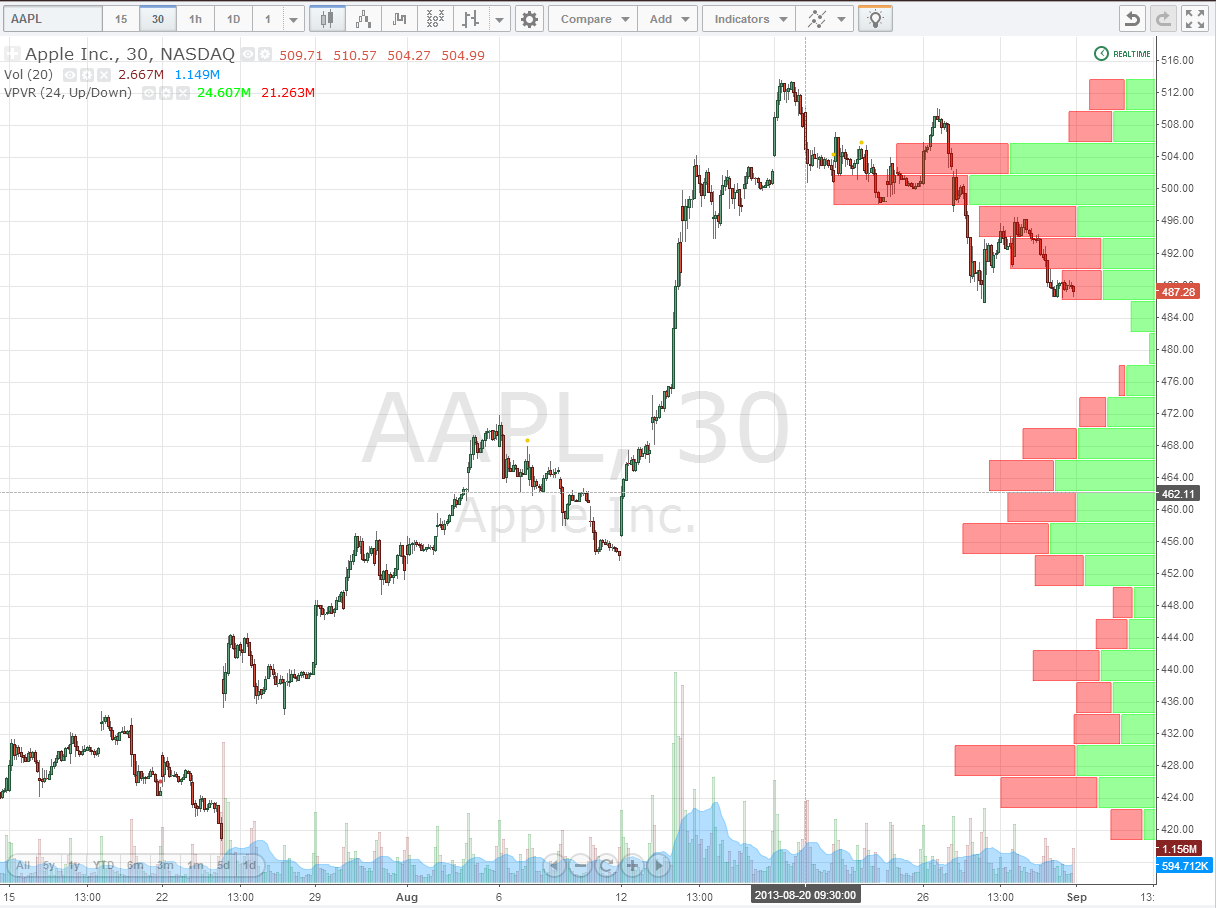
Volume Profile is an advanced charting study that displays trading activity over a specified time period at specified price levels. The study (accounting for user defined parameters such as number of rows and time period) plots a histogram on the chart meant to reveal dominant and/or significant price levels based on volume. Essentially, Volume Profile takes the total volume traded at a specific price level during the specified time period and divides the total volume into either buy volume or sell volume and then makes that information easily visible to the trader.
1 Like
This is for stocks not for Futures trading
2 Likes
Hey this is the definition of “Buy Volume” and “Sell Volume”
"Buying volume is the number of contracts that were associated with buying trades, and selling volume is the number of contracts that were associated with selling trades. Yet we can distinguish buying volume from selling volume, based on whether a transaction occurs at the Bid price or Ask price. "
Borrowed from https://www.thebalance.com/buying-and-selling-volume-1031027
I guess this become important to figure out if accumulation/distribution is happening in a trading range.
1 Like
I too am looking for the information as to whether the trade was made being sold into the bid or bought from the asking price… anyone know how to script for this in tradingview’s platform using pine editor?