Dear Nithin,
Can you add drawing tools as a toolbar on left side of chart vertically with on/off toggle? it will be very beneficial. and another one previous high, low close button to draw line on chart in this chart tool bar too.
Add these two features and traders will find it very useful additions to kite platform…
We have seen that drawing tools are hardly used, so the idea was to not clutter the chart with more buttons and make it intimidating. But I get your point to have this as an on/off switch. The only issue would be by doing that some real estate for the chart will be lost. Will have this checked with our team. I didn’t get what you are saying by by previous high/low/close/ button. There is an info box that shows OHLC of any candle you want right?
Dear Nithin,
Actually it is OHLC values on charts for Previous day plotted as lines if that particular tool made for this purpose however it is not so much required it can be implemented using HZ lines too. My only request is toolbar for drawings vertically on left side please.
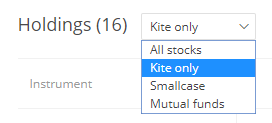
there is a dropdown under “Holdings” tab which provides sort of flexibility to filter your holdings.
can you please provide a feature on that dropdown to create custom filter list so that trader can filter their holdings based on their trading criteria like “Intra day”, “Swing trading”, “Dividend giver” etc.?
I agree with @tushar_Patel and @Amit_Rana1 above, the feature to segregate portfolio into custom groups would be very helpful to track portfolio wise metrics. Right now I am doing it manually in spreadsheets.
Can you make a quick mini trade window that is available on ChartIQ (on the right side) for Tradingview as well? It would be very helpful to quickly move the SL window during a volatile market. Thank you.
Can you please add a keyboard short cut in kite to change the time Chart time frame to whatever time frame user defined. Say like Control + d ( command + d ) for daily timeframe. Likewise Control + w for weekly and control + m for monthly.
It takes multiple clicks to change the time frame and when we are analysing multiple graphs, it’s a big effort. Would be really great if you can look into it