this is so irritating .Every time when I applying pivot level on iq chart the candles are getting small.
Hello @siva-reddy this is great that you have updated chart iq, but there is still lots of bugs in this like:
- OHLC window in the chart is in the right corner of the chart which hidding the actual running, like before that was at left side. This will be ok . Please move it left side so we can easily see the live candle running. Hope you will consider this.
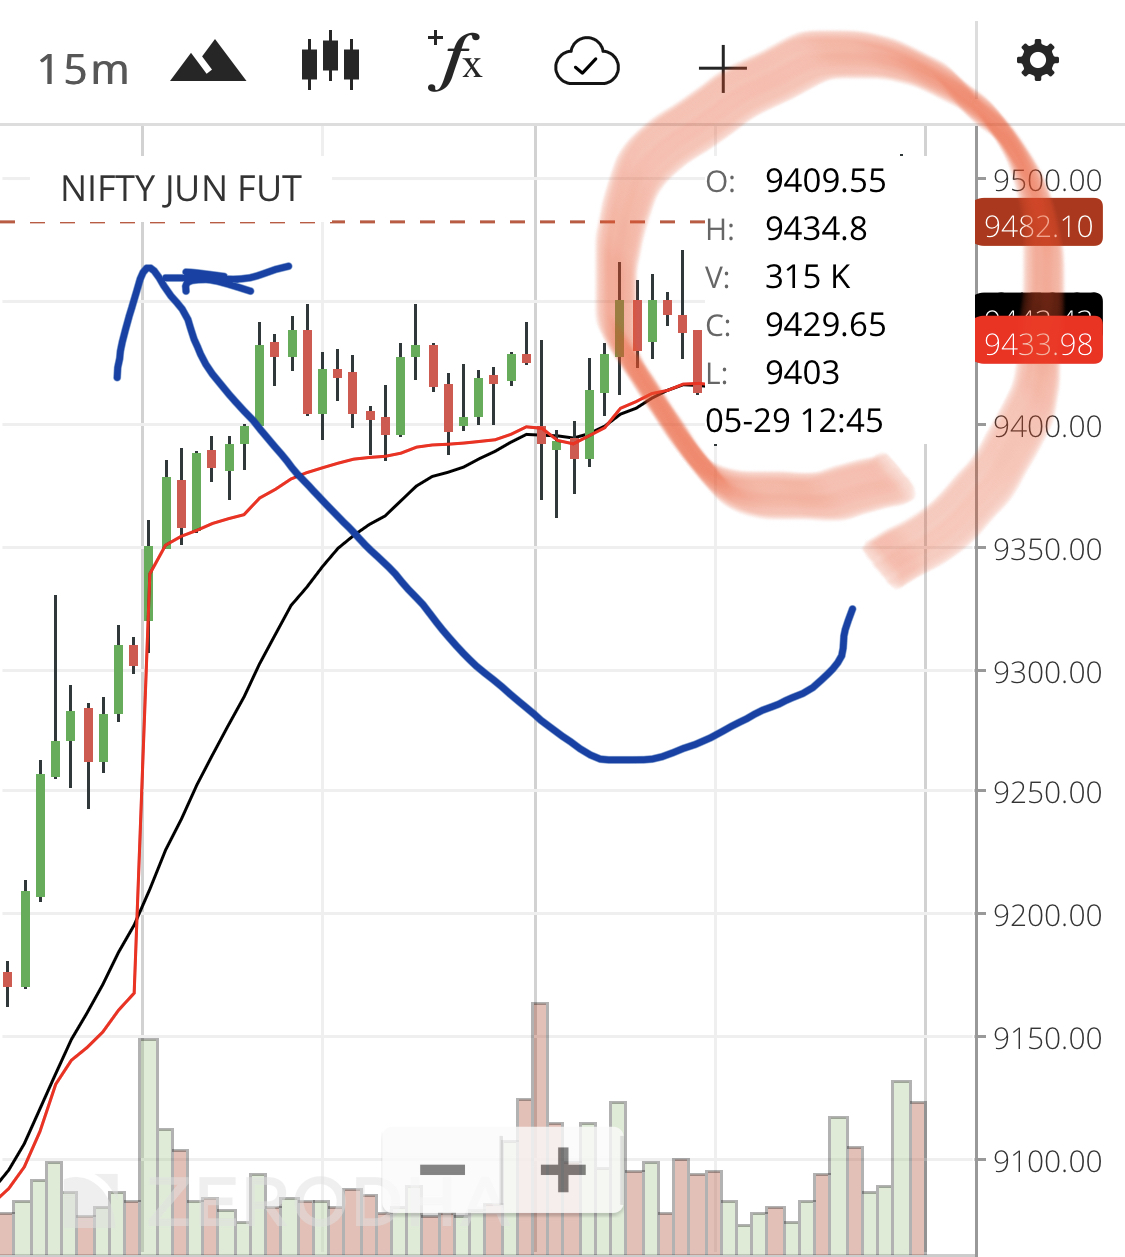
Now pivots show all levels on the screen earlier r3 and s3 used to be outside of screen, hence this.
Right, in our things to do, will try to move that by monday.
Earlier one was pleasing to eye, this new enhancement made it look like congested, how to get the previous view?
2 Likes
the view is very junk…
as we zoom the charts…for plotting trendlines… its candles gatting stretched in horizontal and flattened in vertical direction, which makes difficult to fix open or closing of candle…
Now this looks like upstox charts…
“I was always felt Zerodha is best in charts than anyone else…”
but now…
its copying wrong things from others…
1 Like
Hi
I would like to ask if you plan to add SL-M SL CO BO etc to the “Trade” button. ?
I mean, if we buy a script for X, then how do I add
Profit= X+3
Stop loss= X-2
I hope you got the idea
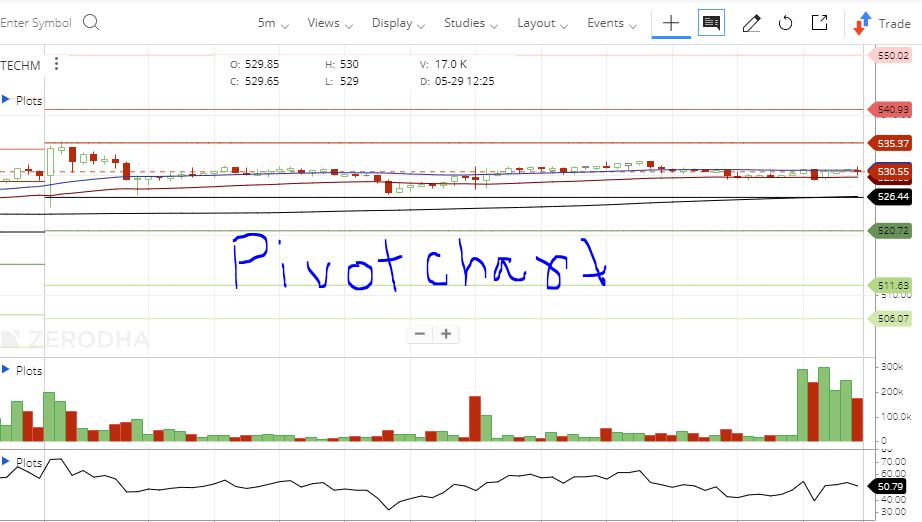
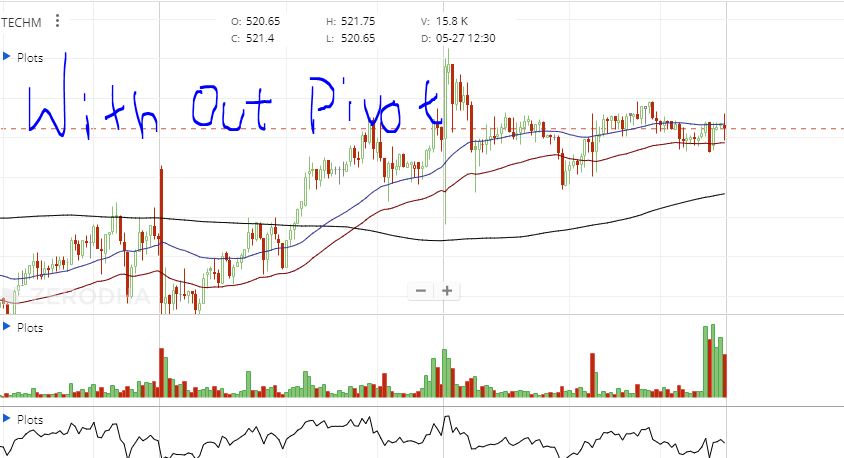
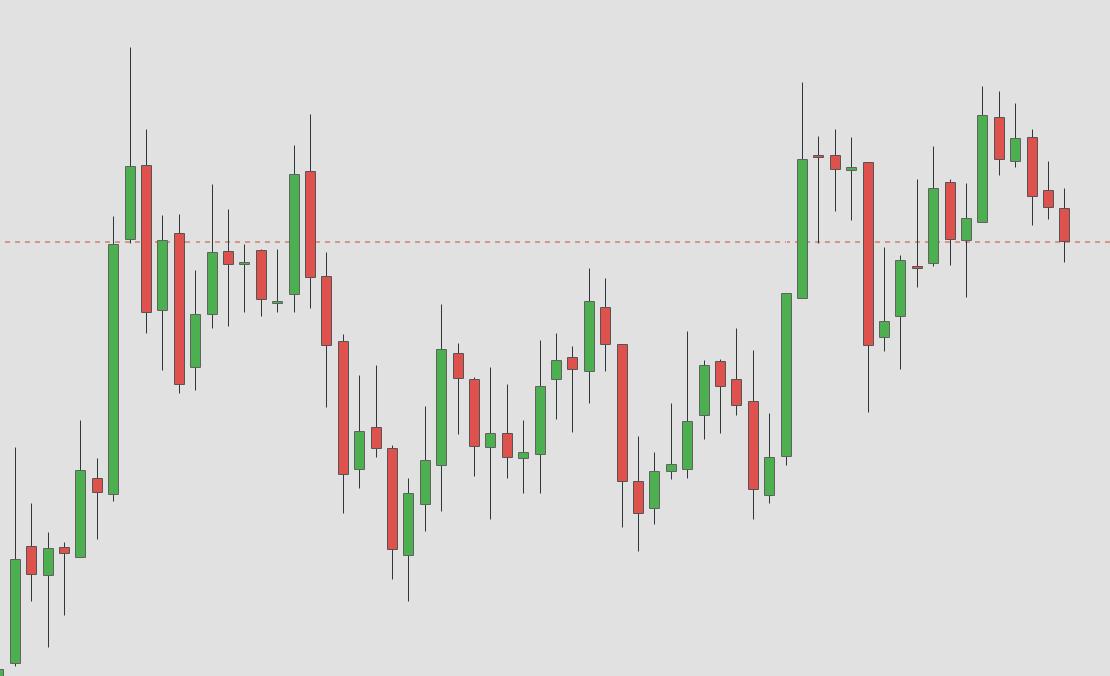
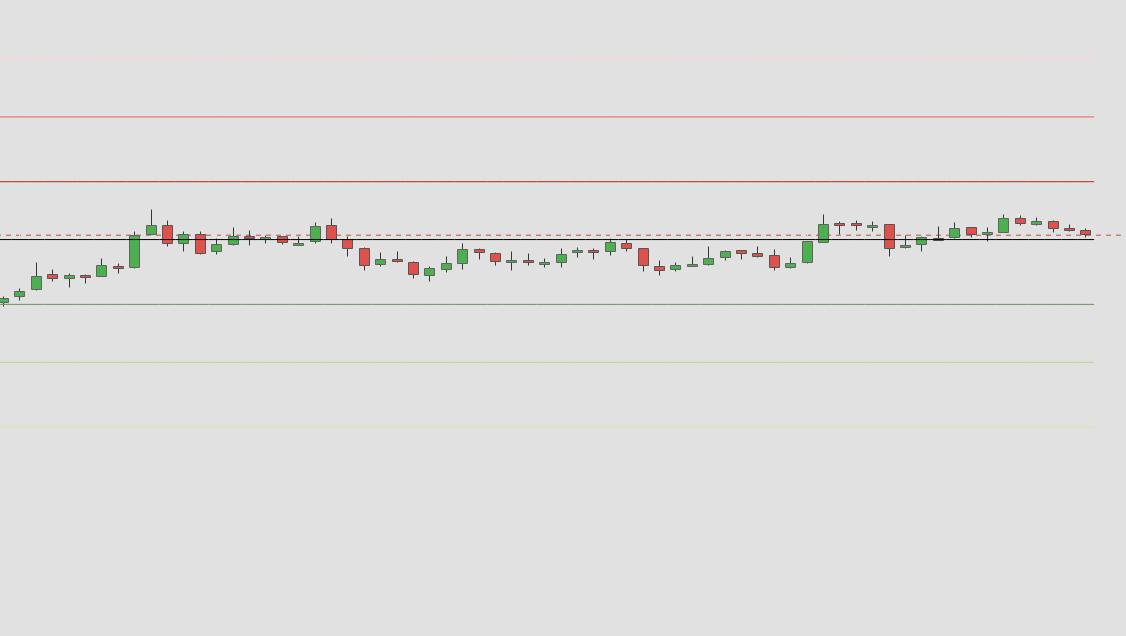
Hello, the problem that haunts every other charting platform has finally gulped ChartIQ too…without pivot points added, the new chartIQ is good, but as soon as the pivot points are loaded, the chart shrinks. This has already been a pain with many other platforms. Can anyone come up with a solution for this?
Just look at the interface, before and after adding pivot points.
2 Likes
Earlier r3 and s3 not used to show on screen but now all are visible hence like this, this is normal behavior.
1 Like
ok, thank you.
Can’t we decide if we want to show S3/R3 or not
2 Likes
Yes… I also wish to get previous view.
How we can get previous view?
or is it new technique to demand more service charge?
same, i m also facing same problem.
requesting all please write on tweeter to revert the chart changes. new chart is with so many bugs. please write comment on tweeter about your problems
To all those facing chart congestion problem after applying pivot levels, just tap on right axis and move your finger/pointer up or down to adjust the view, once done you can lock the view by activating crosshair.
Some changes are good and should be kept.
Although there are some bugs but they can be dealt with one by one.
There is still a big room for improvement, especially the keyboard shortcuts for changing time frames, changing views, adding indicators, changing candle stick types and so on.
And I think once the bugs are fixed, we will soon adopt to the changes.
It’s just an initial hurdle.
Lot of bugs , kindly change to old view or pls option to change
And the plots dropdown in top left, below the scrip name, that’s becoming a pain. Hover the crosshair anywhere in its horizontal axis and the crosshair disappears making the plots to drop down. Please make it drop down only and only if mouse is hovered on that particular element.