Limit/market/stoploss order executed but not showing on chart?

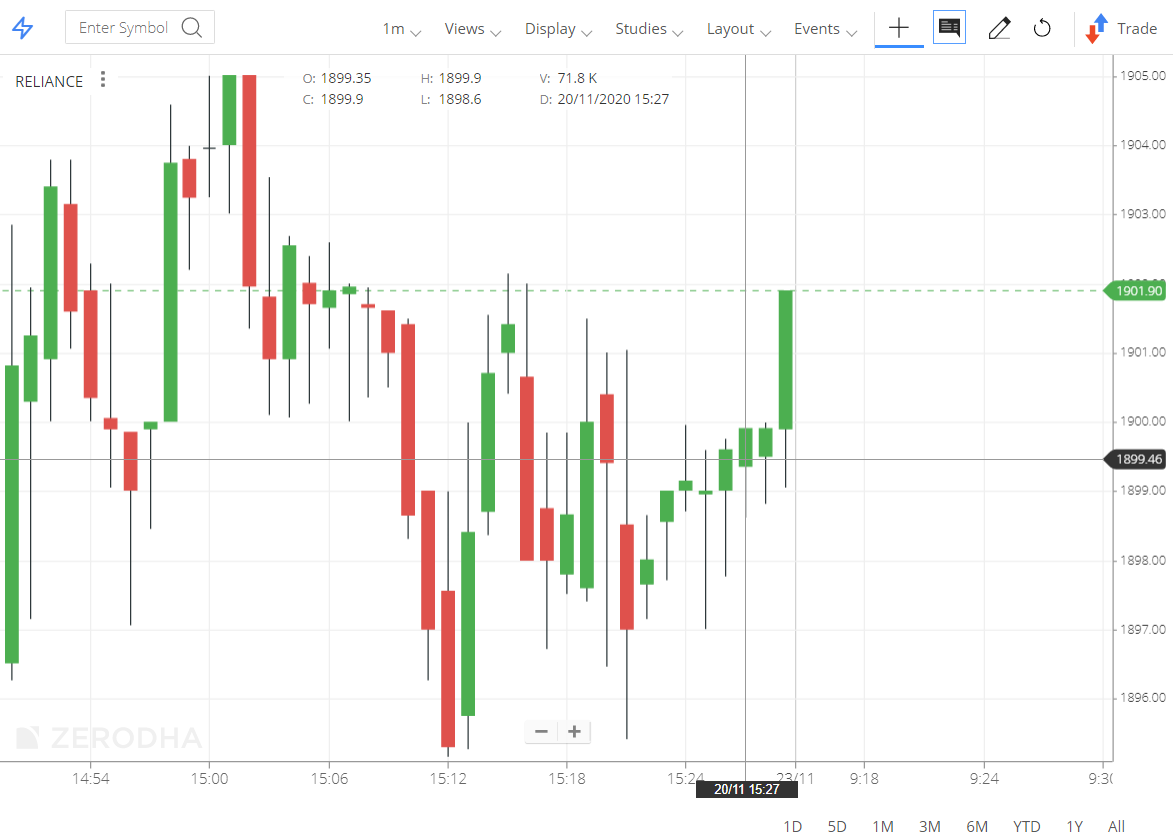
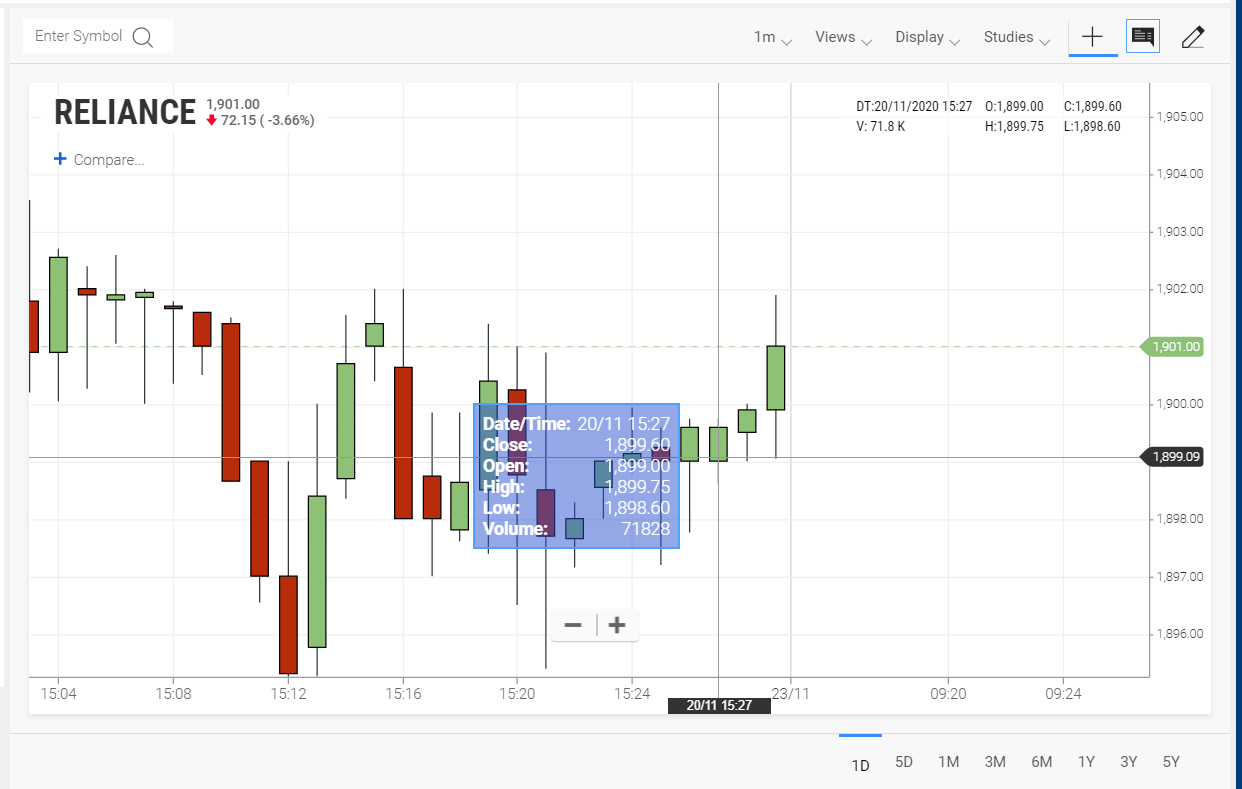
We get this query quite often, “my limit/market/stoploss order was executed, but the price at which it is executed doesn’t show up on the charts. How is that possible?”

Firstly, you need to be aware that it is technologically impossible for a chart offered by a broker (irrespective of which broker) to show all trades that are executed at an exchange today. Here is why:

Lakhs of people are executing tens of thousands of trades on the exchange every single second. Trades on a single stock happens within microsecond intervals at the exchanges, and exponentially more on volatile days. The charts that you see on Kite (or at any other broker) are formed using the data feed streamed by the exchanges. These feeds of “ticks” are combined snapshots of many such trades over larger intervals, for instance one to four times every second, that is, all the trades over a minimum of 250 milliseconds. The charts are formed using those four ticks and not the thousands of ticks or trades that happen on the exchange. So there is no way the chart can show all trades.

Why can’t exchanges send all trades to the broker?

The data feed including every single trade that happens at the exchange every microsecond is known as the Tick By Tick (TBT) feed. Because it is enormous amounts of data, impossible to efficiently send over the internet or leased lines.

This issue of not being able to see a certain price on the chart typically happens when a large order moves the price for a few microseconds which may not get captured in the exchange snapshot transmitted to the broker. Like I said above, there is no technical way to solve this issue today. Maybe in a few years from now when internet bandwidth available is exponentially more than what it is today, we could get exchange feeds with every single trade. This issue exists at all the international exchanges as well.

Execution price

Every single order that is placed, be it market, limit, or SL etc., is immediately transmitted by the broker to the exchange in real time. The actual filling or the execution of the order happens at the exchange. Any price that an order fills it, is filled by the exchange centrally. Brokers have zero involvement or control on order matching and execution at the exchange.

If there is an exchange trade ID, that means that trade is executed at the exchange. You can also verify this using the NSE trade verification module.

What if I want to see all the ticks or trades?

Exchanges give a colocation service where you can have your servers within the exchange premises and consume the premium Tick by Tick data stream offered by the exchange. You have to consume these feeds within exchange premises over LAN and not internet. You would have to then build a program to consume many GB’s worth of raw data and convert it into an intelligent format and consume it right there on the co-located server because it will not be possible to stream it out over the internet. Check more here and pricing here. TBT data is used mainly by high frequency trading desks. It is not meant for retail customers and is prohibitively expensive, and as explained above, impossible to transfer over the internet anyway.

7 Likes

I had a question related to this. Are the ticks that trading members (like Zerodha, etc) get from the exchange similar, or do they differ? Mainly, I wanted to ask, is it the exchange or the trading member who decides the ticks to pick (within a particular second) for the plotting of the charts out of the thousands of ticks (that happen within a given second)?

The reason why I ask this because when I took a random sample of OHLC data for a particular script at a specified time, I noticed that it was different between brokers (RELIANCE at 15:27 on 20th November 2020)

Zerodha -

Upstox -

Finvasia -

In the above example, I noticed that the data was similar on Upstox’s & Finvasia’s charts but different on Zerodha’s chart for that particular timeframe. Is this minor discrepancy in data due to different ticks being selected by each trading member for plotting their charts or due to exchange sending different data to different trading members? I read an older thread (Why is OHLC data different on live charts and marketwatch? - #3 by nithin) but that doesn’t deal with my particular query.

Firstly you need to know: Live candles are formed on your computer/phone using ticks that you receive from us, and historical candles you get from our servers when you refresh or open a chart. So when you refresh a chart, only the latest candle is live, the historical you get from our servers. But if you keep your charts open, the candles formed are using the ticks you receive. The ticks you receive again depends on your internet and connectivity.

Coming back to your question, yeah, the snapshots received at brokers could vary. Brokers receive this data over the internet from the exchanges, and hence potentially it could vary. Broker in turn sends this data to the customer over internet, so the live charts between two customers at Zerodha could also vary based on internet/connectivity at the customer end. Of course the variance will not be obvious, but technically it can vary. But if two customers of Zerodha request for a chart, it will never vary because the historical candles are formed at our server, only the live candles are formed at the customer end.

1 Like

Hey Nitin,
On that little point, I came across charting tool which allows to trade on chart with drag drop facility showing where we entered and where we can put stoploss and shows the live PnL for that scrip in a small box. Is that incorportable in our Zerodha.

Have you checked this

1 Like

being no.1 broker why you are not able to provide chart trading in trading view like fyers.
because of good trading view charting options in fyers, i think many are shifting to fyers
why not zerodha try to provide chart trading in trading view charts

also bracket orders are not available in zerodha
why not allow bracketorder in zerodha keeping required safety margin from brokerside

Hey Nithin,
Thanks for the reply.
Yes I have been using that quite a lot . Thats only available in ChartIQ not in TradingView I guess and live PnL doesn’t shown up there . If we have to incorporate everything solely on chart, we would love to see a small ticker just beside the latest candle showing PnL so that setting stoploss for exit is convenient.
Thanks and Regards

Can this feature “Trade from charts” come into effect on kite mobile as well ? @nithin
It makes the life of a trader easy, to deal with multiple order types is cumbersome and time consuming

Tricky on the mobile to draw lines on charts.

Just like TV has it . They have a very nice and stable order management system on their mobile app. Quick and easy to drag order management system . Which is quite good and feels nice to use … why can’t such a feature brought back to Zerodha kite mobile ? @nithin