Thanks for the reply.
First, It is an MIS strategy, so I don’t think it is dependent on previous day data.
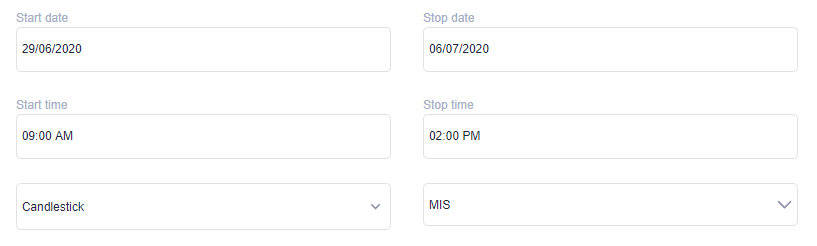
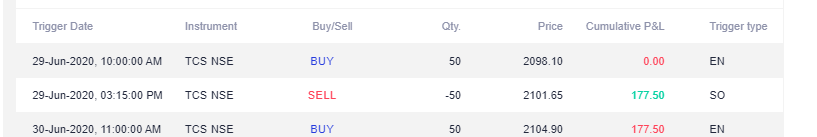
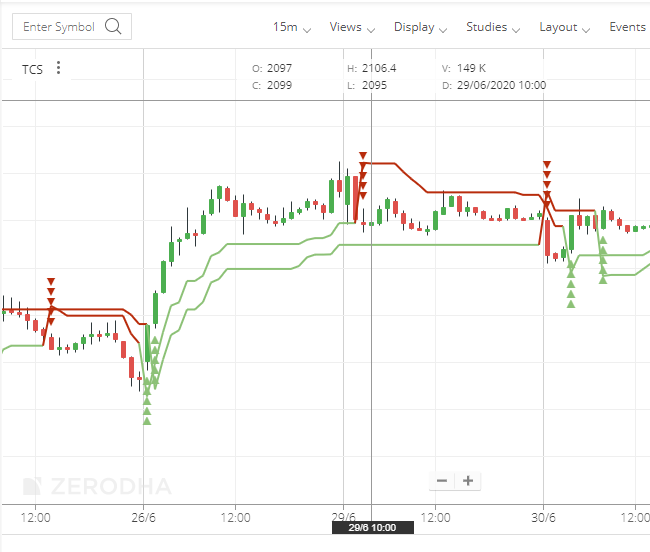
Second, I give you the screenshot of strategy starting from 29/06/2020 but in actually I created another strategy which was starting from 15/06/2020 and the result was same, it was giving me the FALSE buy signal on 29/06/20 at 10.00 AM using this strategy.
So I’m requesting you to please cross verify the signal of 29/06/20 at 10.00 AM using above strategy.
Indicator smoothing does not depend on MIS or CNC. If you use a 200-period moving average on 30 min candle, a single indicator value cannot be generated from 1 day’s data. In your example, the backtest starts from 29th June, the first trade was generated at 10 AM candle. i.e the 4th 15min candle. The Supertrend parameter you have set is (7,3), so 1 value is generated after considering 7period values. It cannot give proper values after taking in 4 values. it is like asking to calculate a 200-period moving average by taking in 70 period data.
If you are facing issues even after making changes to the start date, you need to write to [email protected].
Today I again tested another strategy and it again give me FALSE trades.
I strongly feel that there is no mean of backtesting if the result are false due to any reason.
I understand that Indicator smoothing takes time but please let me know how I can evaluate the strategy performance because on 15 min candles you cannot take period of more than 3 months and it takes long time in 30 period Moving average of “14 period RSI” Indicator smoothing.
Please help me, Is there anyway I can backtest using 15 min candles with less FALSE trades ?