New feature - Account value curve on Console

When you log in to console, the donut graph is a visualization of the account value for that day. Essentially the exact value of your account if you were to exit all holdings and positions at the previous closing price.

Account value =
Free cash
+Stock holdings value (previous closing price)
+Direct MF holdings value (previous day NAV)
+Pledged holdings
+Margins blocked for F&O
+Buy option premium ( previous closing price)
-Short options premium (previous closing price)

We now have a visualization for you to track the historical account value. This will give you a great indication of how you have performed. You can, along with the account value, also track your equity and MF holding values separately.

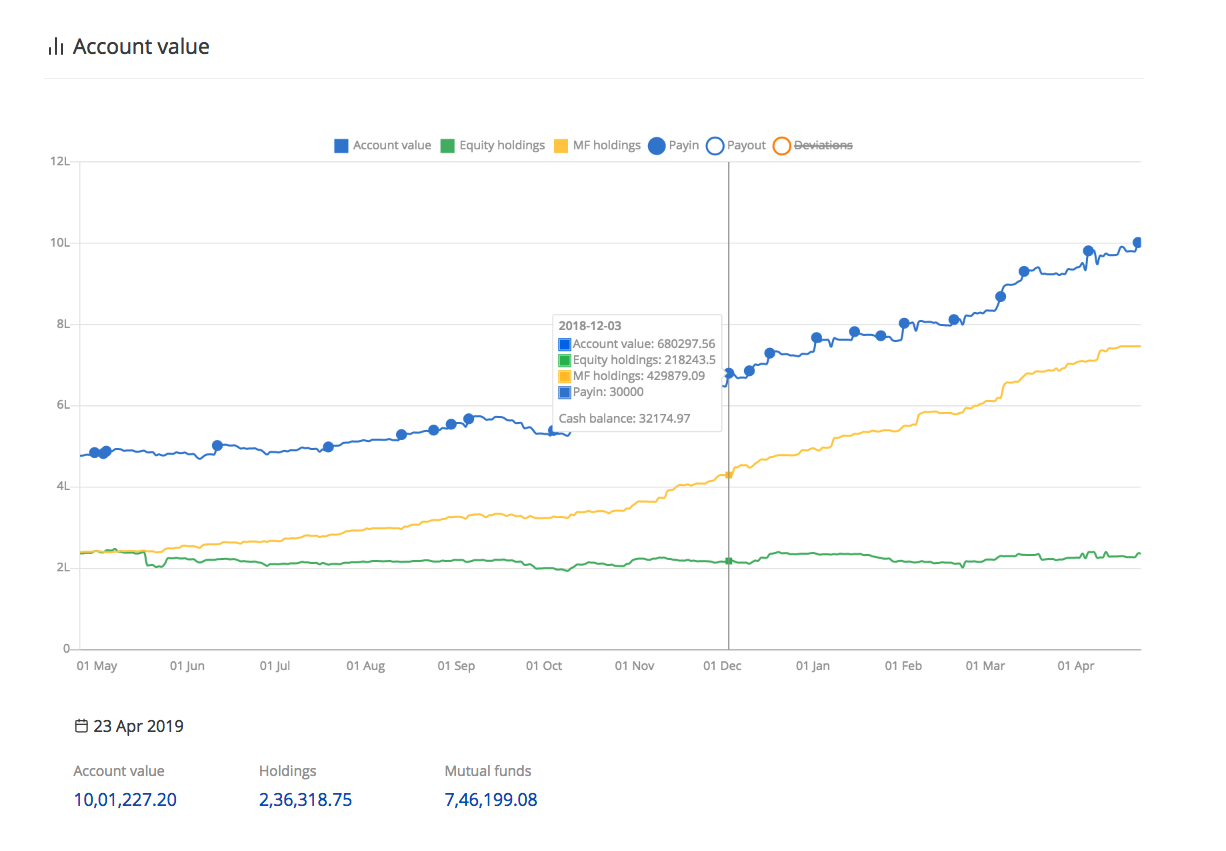
Click on any of the labels to enable or disable the view. For example, check the below image with MF holdings disabled.

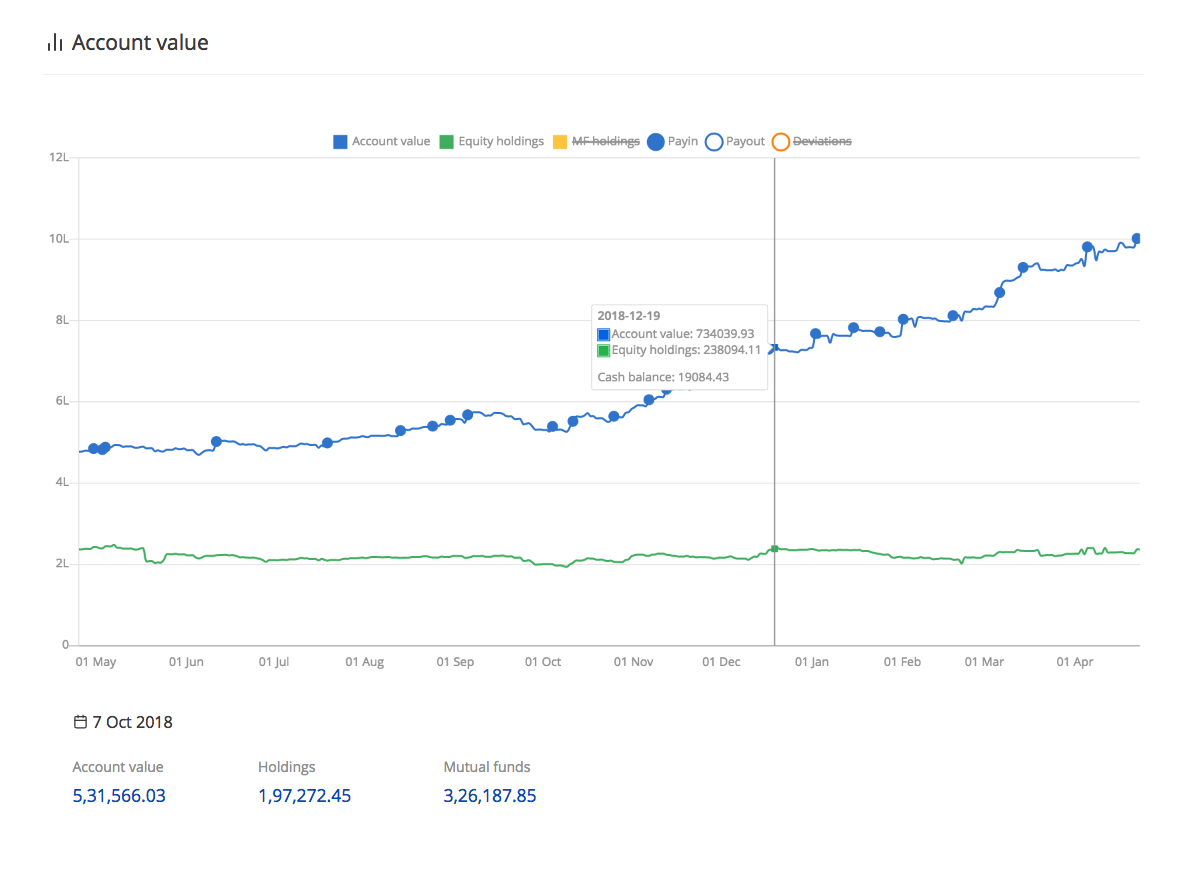
Not all graphs will be this smooth, there might be jagged points due to payin or payout of funds. The payin/payout labels will tell you the dates and value.

There might also be these edges when you apply for SGB (Sovereign gold bonds), Gsecs/Tbills, Quarterly settlement, and FFO (follow on offers) where funds get debited and then units/funds get credited after 1 or more days. Until the funds or units come back, there will be a dip in account value. We have a label called deviations which will indicate the reason for the dip or bump up.

The curve might also be jagged when there is corporate action on the stocks you hold - like stock split, bonus, etc when the price drops due to corporate action but the new split, bonus or other corporate action stocks are yet to be credited.

This feature is in beta, so let us know here if you spot any issues. We have a few more really cool visualizations coming up on Console to help you track and improve your trading account performance.

18 Likes

looing forward to the other pending features.Visualization of trading account is really needed as doing it via any other utilities is cubersome.

1 Like

mine is heavily distorted due to frequent Payin/Payout . Isn’t there way to get smoother graph. By the way nice effort.

We will soon have a graph based on P&L of the the account. Cumulative sum of all daily P&L. That should give you a curve on performance. We will allow you to compare that to a benchmark as well.

4 Likes

@nithin

  1. pie chart to show what percentage of portfolio invests in which industry. The percentage distribution.

  2. Dividend information to help save us manually counting from our bank statement. Also add this info in the downloadable p&l report

1# A provision to choose a date range (duration) will be great
2# The P&L graph should also include brokerage

Present Account Value Curve is not useful at all. It is showing above 20 Lacs on so many occasions where as my max account value at any moment is way below that figure. It’s very puzzling.

We need an Equity Curve which is smooth enough (visually) to analyze at a glance that our trading activities are on track or not. And it should include actual P&L + Brokerage for correct picture.

Yep, both coming soon.

Yep P&L curve after brokerage charges.

Can you share your client ID on email to @Nakul ([email protected]) we will check on the issue you pointed out? Account value can’t be more like you have mentioned.

2 Likes

Nithinji, I n Console, I have entered the price of Nifty bees (which has been transferred from Motilal) . Total price variation is in lacs. I contacted Support team but they informed there is no provision to alter the entered price as of now. How can I incorporate the original value? Please help me.

One can’t keep on changing after entering once, but you can create ticket here with all details and our team can change it for you.

Dear Siva, I have already raised ticket on 29th February, 2019. Ticket no20190226575829. As per your advice I reopened the ticket. I closed my account at Motilal and all securities transferred to Zerodha. I done mistake in entering original value in Nifty bees only. 91 Nifty bees bought at an average price of ₹800. This has to be changed.
Thank you, Siva

Siva,. Thank you. Your team mates have rectified the mistake done by me. It’s a very good help.
Thanks a lot for immediate response.

Hey, now one can get dividend info on console itself.
For stocks one is currently holding, dividend info can be viewed from holdings page itself on console.
image

One can go to tax P&L and check for all received during the financial year.Need to download the tax P&L.

2 Likes

thanks @siva @nithin and team.

1 Like

@nithin,

Zerodha is improving the technology that is very good, but i think zerodha support services should improve.
I have applied 3 in 1 account for existing zerodha account. POA is received on 5th March 2019 but not activated yet. When i raised ticket i got replies like POA not received , Case Id not created, Pending from IDFC will get updated in next 48 hours etc.
3 in 1 account is not activated till date if you want i can share ticket id and other details.

Please share me ticket details.

@siva

Ticket id - 20190411338490

@nithin @siva,

My issues still not resolved ,more than 2 months gone but not activated 3 in 1

Hey, I believe you got a reply to your ticket, I was told it should be solved in this week.

@nithin @siva. Console main page Graph should allow to customize date! User should have an option to select preiod wise.