For academic purpose only.
Nifty Options : Looking for a 40% move everyday using daily Nifty index movement
Prev discussion :
For academic purpose only.
Nifty Options : Looking for a 40% move everyday using daily Nifty index movement
Prev discussion :
You mean to say options will move 40% in a day or we can catch 40% movement in options everyday?
Hmm, options could move any %. Here i’ll look for a single 40% move everyday - in the direction of the market. And hopefully find ways in which it can be caught.
I believe you are saying about current weekly expiry ATM options?
You are believing this move can be caught daily? also I am again asking what should be the stop loss or how do we know it is going against the direction after initiating the trade?
Yes, always current week expiry. Need not be ATM all the time.
Its worth observing and finding out, for sure.
Let’s keep a record of the movement here and then we can discuss stoploss given the scenario.
Why just 40%, it can be 100% or above also, personally I believe we should have real, achievable targets in mind to start with and yes once in a while we can catch more than 100% move also in options but for sure not possible to do it daily. But yeah lets see how this thread goes.
Also maybe you should put a disclaimer that you are not a RA kinds and this is for academic purpose only at the start of the thread.
What target you looking at?
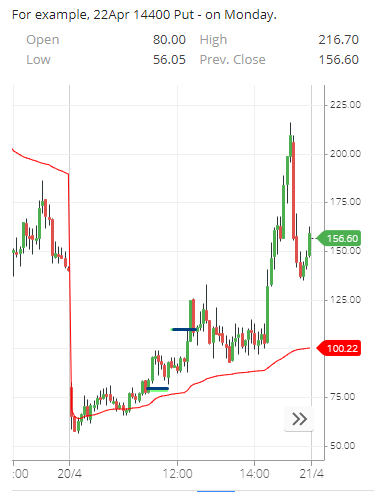
14400 Put made a lot of movement on Tuesday. But I still only factored in the 70 to 100 movement which is the 40%. Anything over and above that, or lesser than that, is up to the trader. Can also enter a 2nd 40% trade from 110 to 150 or 14300 from 70 to 100, but that’s outside scope.
It will be an end of market study only, no live stuff. And maybe I will post some of my trades later when I take them and if it works.
Your title is somewhat misleading. Nifty (almost) never moves 40% in one day because of the circuit limits. But you are referring to weekly options and their dwindling prices.
Why wont you simply get historical data and do back testing to find out? In fact serious traders have already done that. And the outcome is that the long positions you take has got a one third probability of returning a profit.
Meaning: if let say, you buy a Rs.70 option the probability of you being able to close it at Rs. 100 or above is 33.3% only. 66.7% of the times price drops to 50 or 30 or even zero. Having said that there are traders that make money doing this but the ones that do it over a long run are very few.
Hoping that there will be a 40% upwards move everyday(for puts or calls) and hoping that anyone can anticipate and take positions precisely is preposterous!
I don’t want to be dampener to your enthusiasm. Just want to set some realistic expectations at the outset.
Good luck with your pursuit.
Options move 40% a day and is a normal thing, whole point is users catching it on daily basis.
If it is end of market study then won’t hindsight bias play?
Will keep a record here of how and when the movement happens and it could work as a study for those who want it.
What are you suggesting I do?
Pre movement posting it is the right thing. Post trade will have hindsight bias.
You saying a post trade study will have hindsight bias? How else does one study?
Should check the generation of signal, entering the trade, managing it and booking it.
What signal generating where? Cool will keep this study to myself - will collect my own signals based on studying the index and the option.
Is this publicly available study? I mean backtest on historical options data?
I am not referring to a specific back test, this is a general observation about the nature of Long and short option contracts. Having said, If you do a back test with your trade plan/strategy, you would find the same outcome. And if you do not have a reasonable risk management or hedge, the odds would be even worse. I have tested debit strategies and found the winning accuracy to be below 30% over a period of 1 year or longer.
The genesis of this analogy is derived from the odds of outcomes. Here is how:
Let say you have a bullish market view. Now you could either buy call or sell put. Now the market could do one of the three things - Go up, Go down or stay flat. What are the P&L scenarios for a Call buyer and Put seller in these three cases?
| Market Up | Market Down | Market Flat | Win | |
|---|---|---|---|---|
| Call Buyer | Makes Money | Loses Money | Loses Money | 1 out of 3 |
| Put Seller | Makes Money | Loses Money | Makes Money | 2 Out of 3 |
This basic principle gets manifested in trades over a long period of time of at least 100 trades or more. And if you backtest your setup both ways you can see that for yourself. You could try this in stockmock.in
Hope that makes sense!
Hi Bharat,
I know lot of people don’t understand your deep knowledge that you want to share for free.
Let me offer you something, I pay 1000 rupees for every successful 40% move in ATM /ITM weekly nifty or bank nifty options on an intraday basis if you give me when to enter.
The payout happens to you on month-end for 20000 rupees(20 trading days in month). assuming all 20 days I got 40% return. If any day I am making losses, the payout will not happen.
Hope this deal is good. DO let me know if you are ON- I will share my contact details.
Thanks for the detailed reply
On a lighter note, if right 5 days, will you pay 5k