We know that open interest is open, unsettled positions. So, say, if one is looking at a price candle, the corresponding OI candle would show the real time (open interest at the same duration as that of price candle) OI or the OI corresponding to previous price candle? Or the OI is shown something at real time and then adjusted later after market close?
example: OI candle for 10:30 to 11:00 shows OI till 11:00 or OI till 10:30? @nithin
The Open Interest displayed will be until 11.
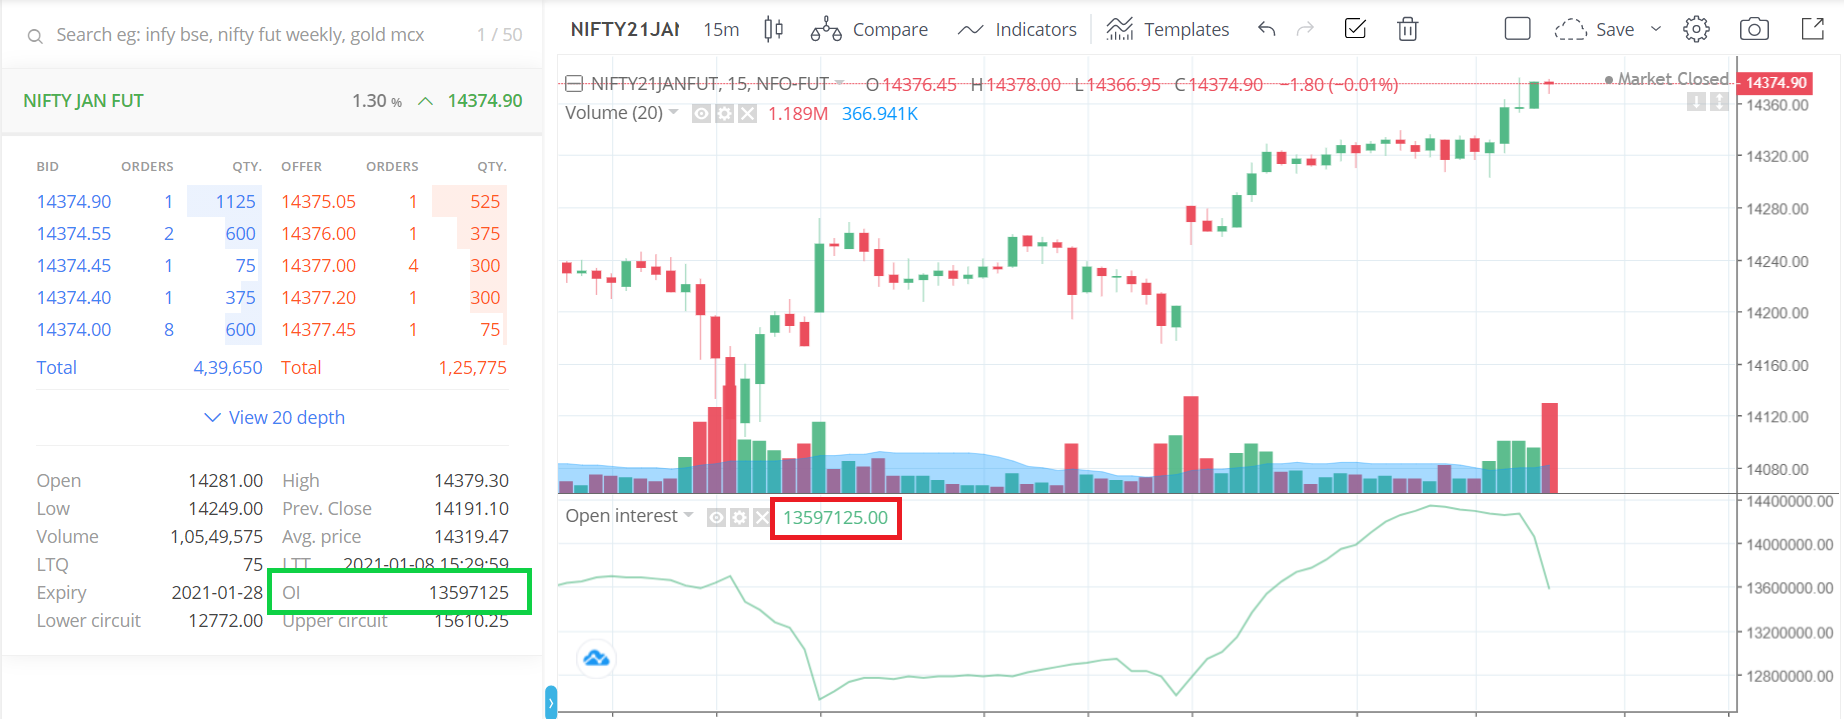
To give you a practical example, check the Open Interest for 3:15 - 3:30 candle and Open Interest in market depth at market close, both are the same:
1 Like
thanx @ShubhS9 . yes they are same.
But just like OHLC data is shown on chart, but later it is changed and adjusted (as explained here), isn’t it similar here? Or it keeps updating real time similar to volume chart, macd, vwap etc which keeps updating in real time with trades?
The post you have mentioned is about prices, Open Interest is an indicator just like Volume, VWAP, MACD etc. indicators.
1 Like