If you apply Bollinger Band, it will become even more clearer 
I don’t follow any indicator. useless.
2 Likes
Candlestick is also indicator bro.
3 Likes
Who told you I follow it ? Its just a past data nothing else.
1 Like
So is Bollinger. It’s just standard deviations from the mean. Newbie didn’t tell you to follow it either - just that it’ll be much clearer just like candlesticks give more info than a line chart.
But I don’t use this while trading. I see percentage.
-2, -1.5, -1, -0.5, 0, 0.5, 1, 1.5, 2 index
Then I see stocks in index. Mostly bank nifty so it is easy to track banks.
Yep, forgot about that. 
US futures should be open. 
I use Keltner channels with 1,2,3 ATR bands. 
Same thing, but I find it easier to parse. 
So 3 KR indicators with overlapping middle line?
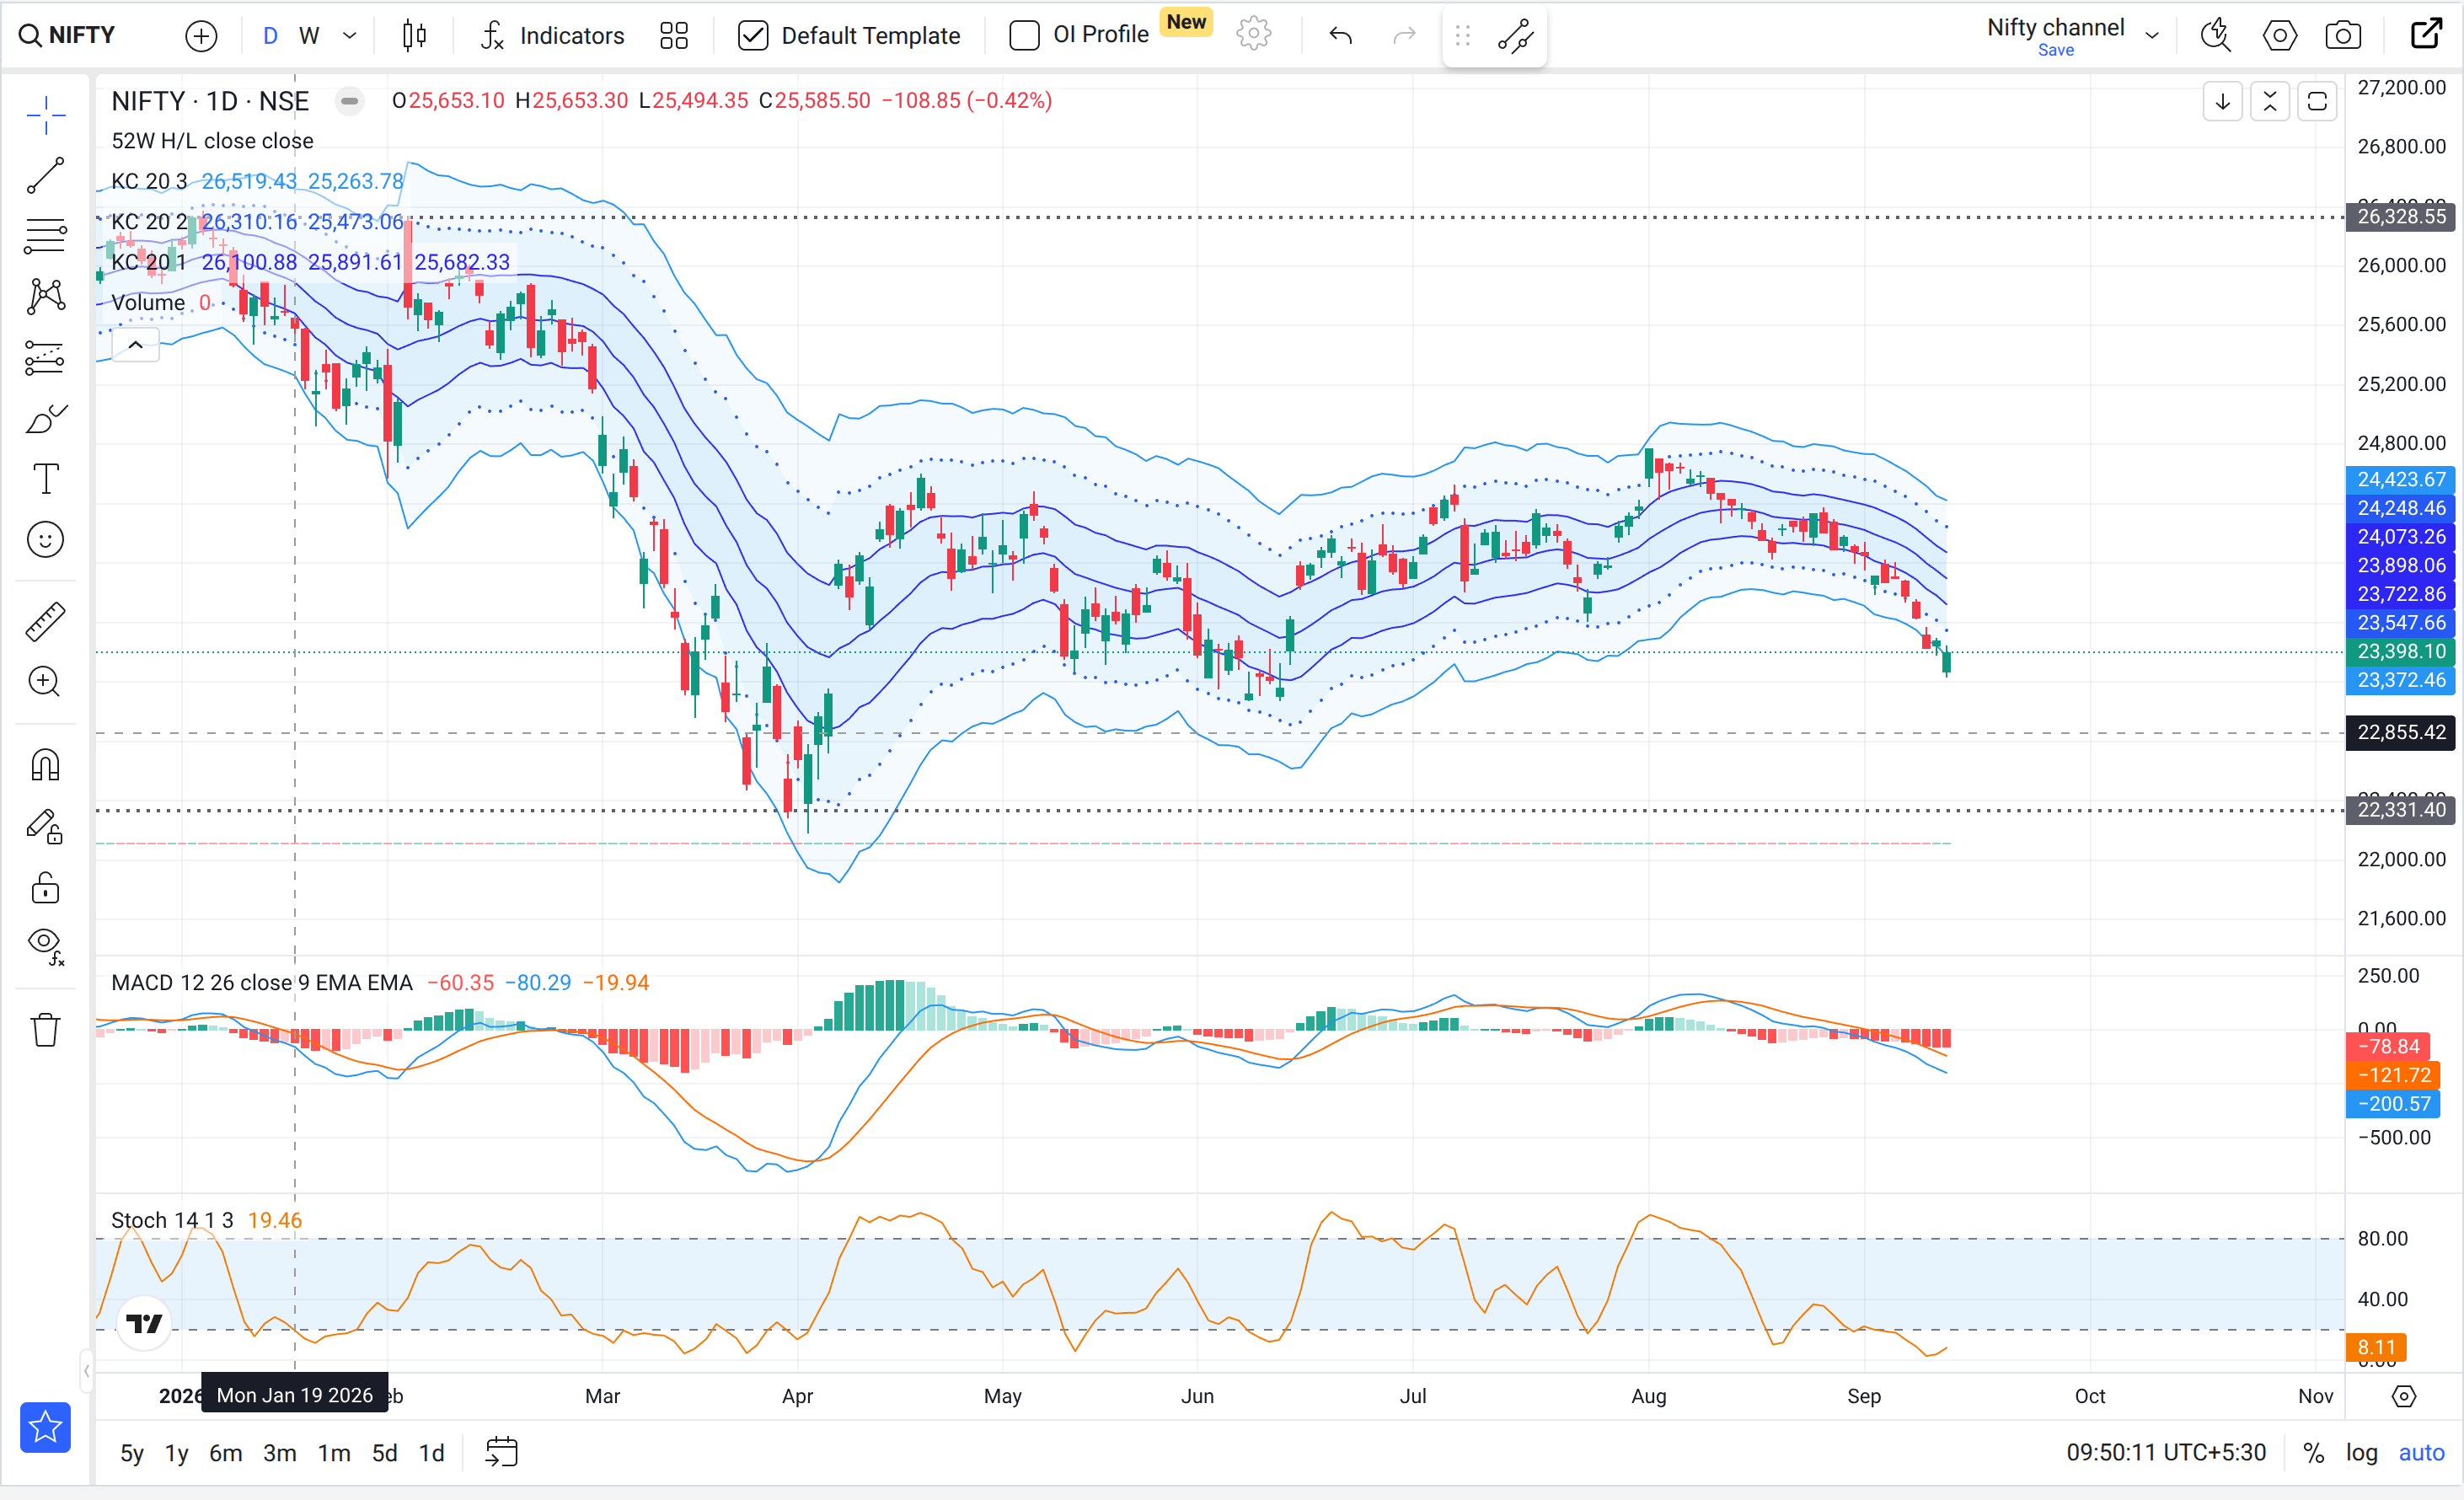
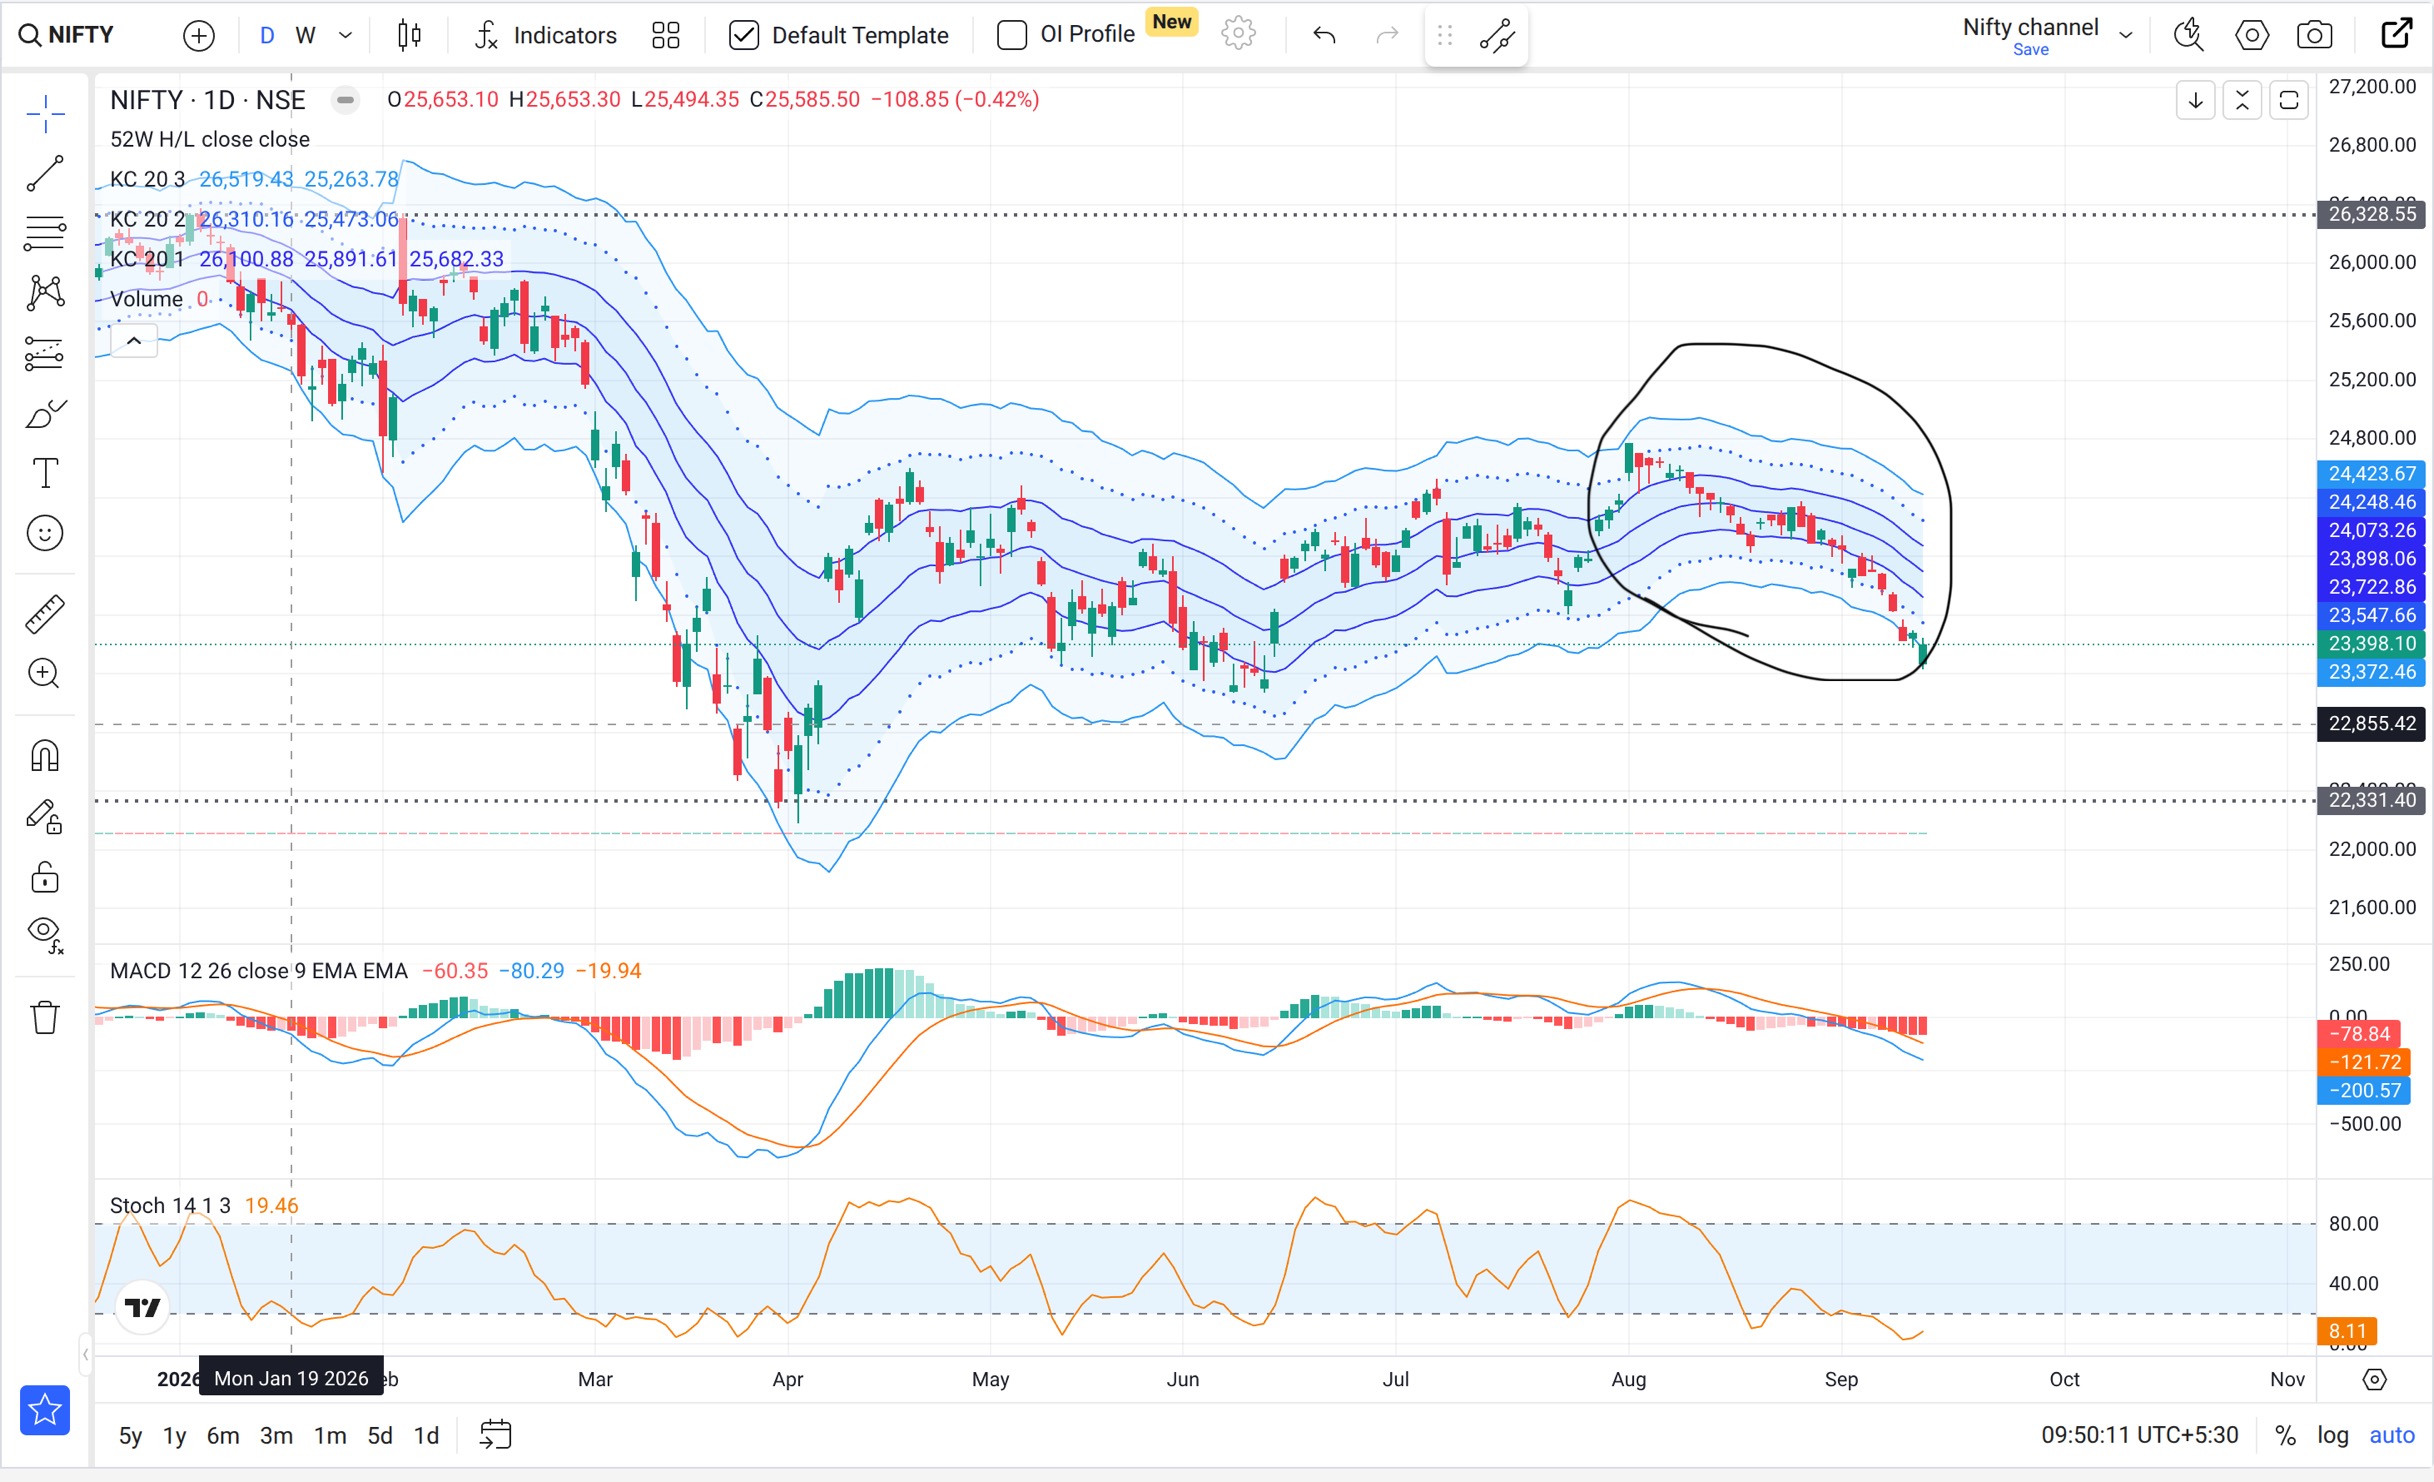
See this does not tell anything that where does index will go from here.
I like clean chart layout without any indicator.
This is my last reply on this. EOD
Does it have to? When you said,
Did the candles say something about reversal? What is it about that picture that made you think it is oversold or that it will probably revert from here? Interpretation varies. Facts are the same. Indicators are mathematical facts represented in a visual form to guide an interpretation.
That’s fine. To each their own.
We can have a respectful, productive discussion and exchanging of ideas here and we don’t have to agree with one another or get offended or insulted if our ideas are challenged in any way. If we all agree, this will be a non-productive and a boring place 
2 Likes
I just wanted to say that indian market fall for 6 week continuously. Look at others market weekly charts.
While true, there has been no panic selling - it was a slow daily fall.
1 Like
Depends on which chart you’re looking. 
Mid and small caps are looking strong in India. 
There are a few ways to trade KCs:
- The middle line can be thought of as value.

- Price oscillates above and below value when the market is in equilibrium.

- When price moves to extremes, we can expect it to mean revert eventually absent any fundamental triggers.

- When prices are rejected from value strongly either to the upside or downside - coupled with fundamental triggers - that may be the start of a new trend.

But the most beautiful setup on this chart is the divergence between price and stochastics at the end of that March downtrend. 
1 Like
Just curious to know , why you are looking at the past data
I removed all the Indicators but used trend lines ,it seems Nifty will go down further , i may be wrong because on daily chart Indicators are showing over sold if apply it , where as on weekly its not .
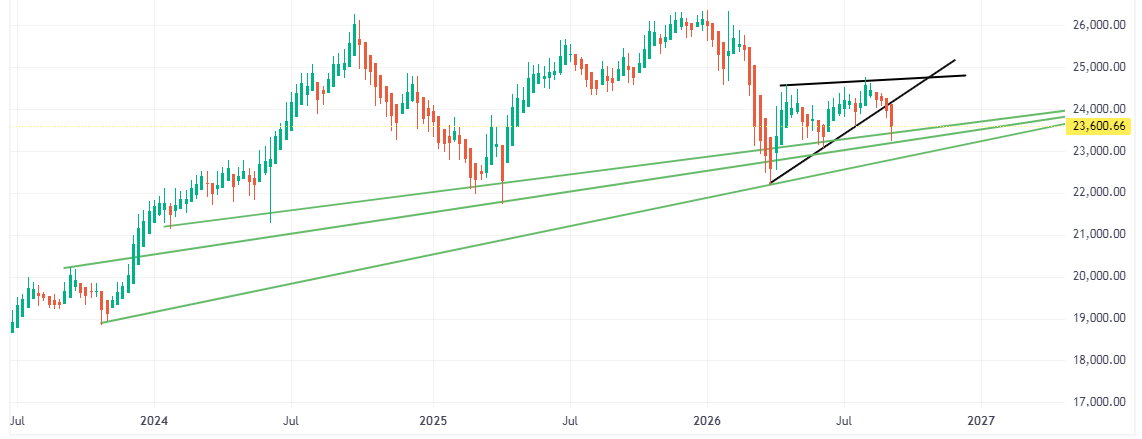
While Zerodha view was being skeptical of Stock Market condition , probably Dhan wants to cool down its stock Investors 
Already answered it. 6 weeks continuously falling
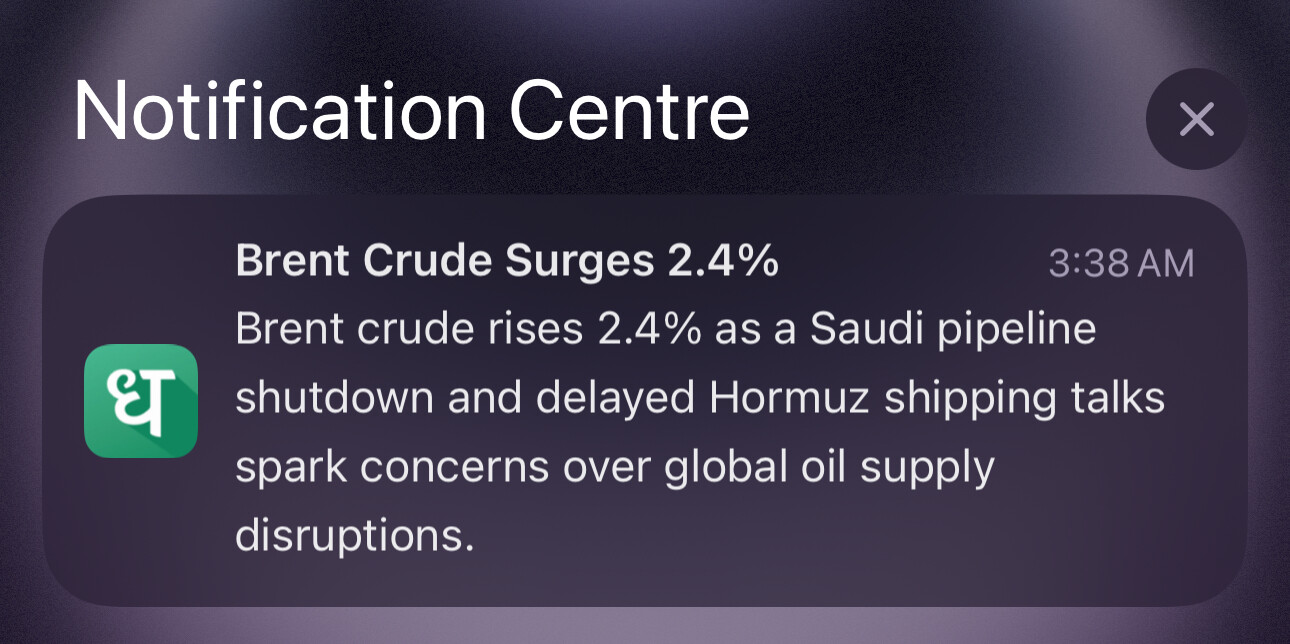
Honestly those headlines are very misleading. It didn’t even cross yesterday’s high after saudi pipeline shutdown. Zerodha is slower than turtle in implementing features(like n notifying trading holiday on last trading day), but I’m glad they don’t shove these nonsense as news in my notifications.
2 Likes