Hello everyone,
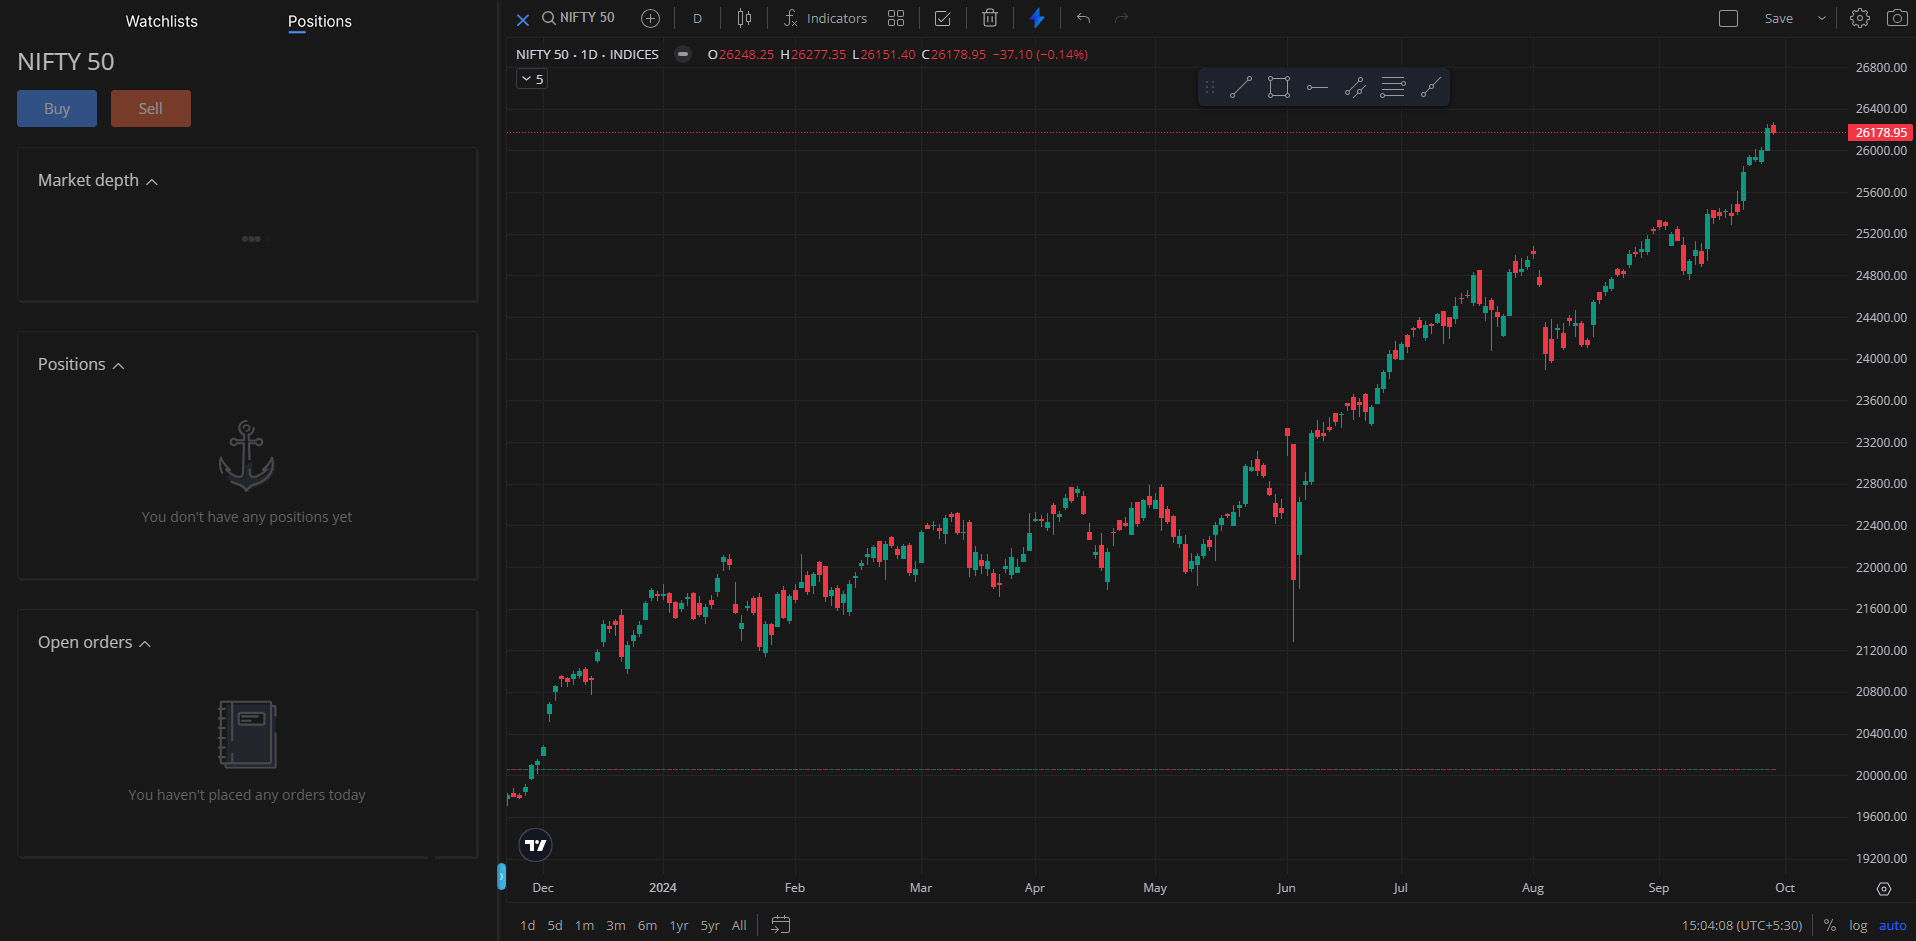
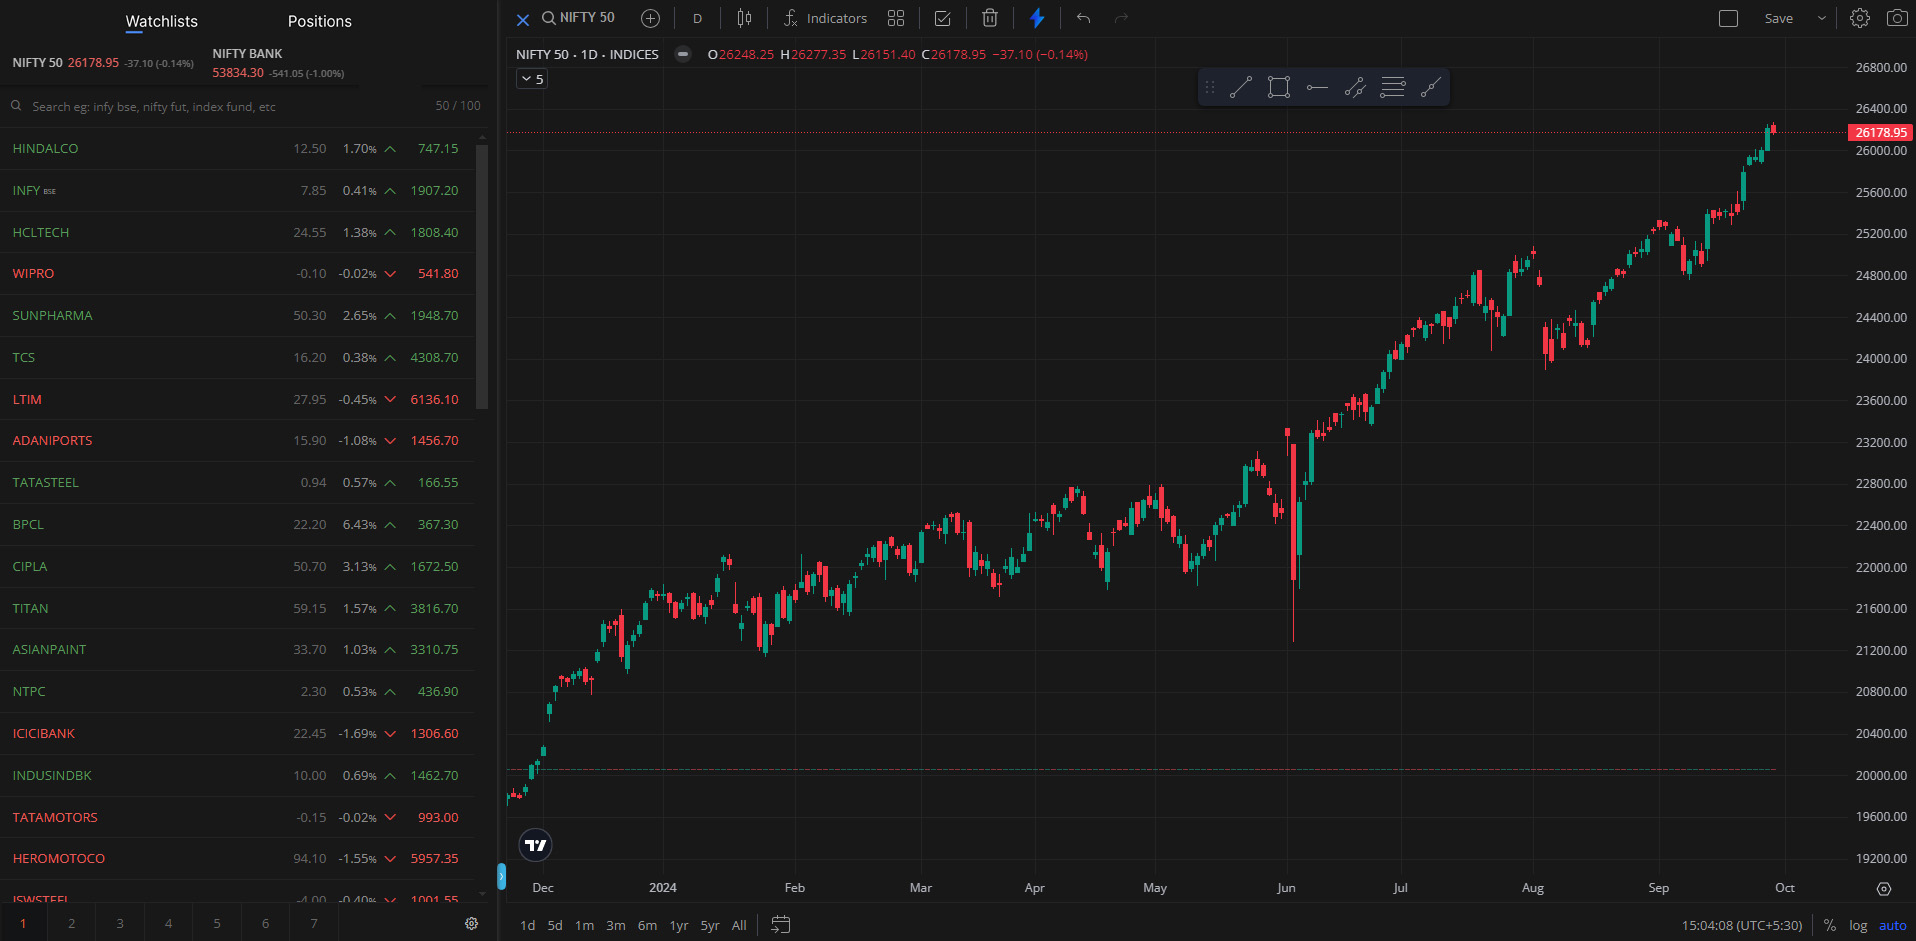
I’d like to suggest a new feature for the popout charts on Kite for web. It would be great if the popout charts included watchlists and positions on the left sidebar. I’m interested to hear your thoughts on this idea.
Hello everyone,
I’d like to suggest a new feature for the popout charts on Kite for web. It would be great if the popout charts included watchlists and positions on the left sidebar. I’m interested to hear your thoughts on this idea.
![]()
![]()
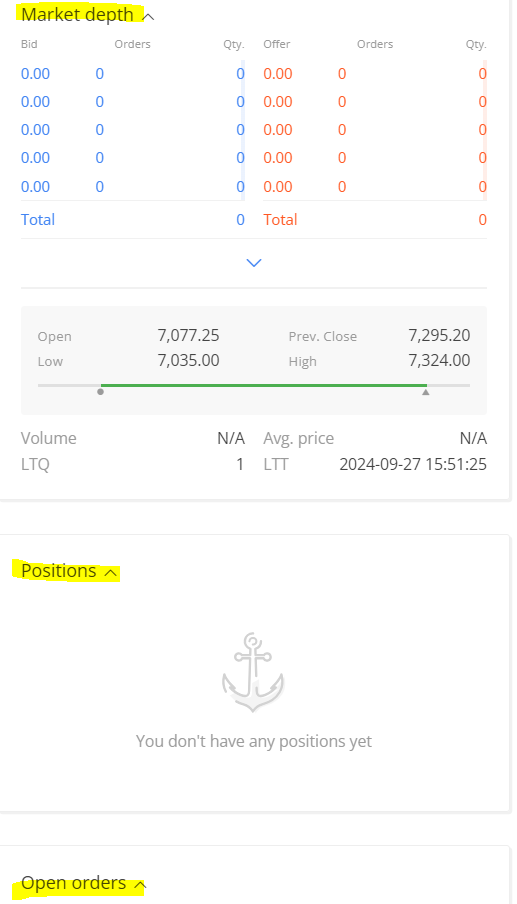
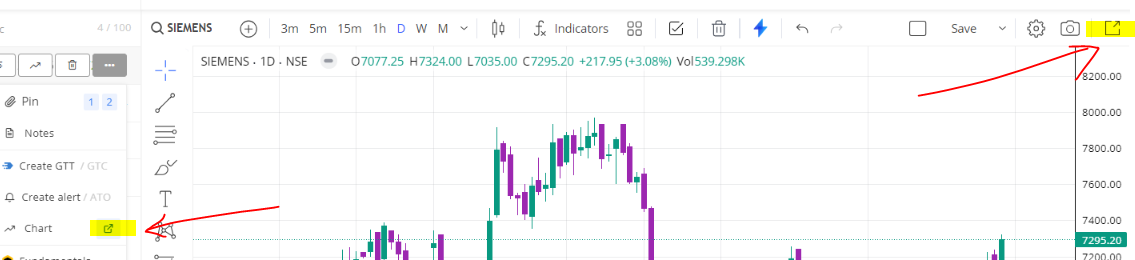
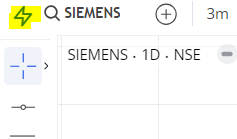
positions, open orders and market depth features are available. just click on the shazam symbol.
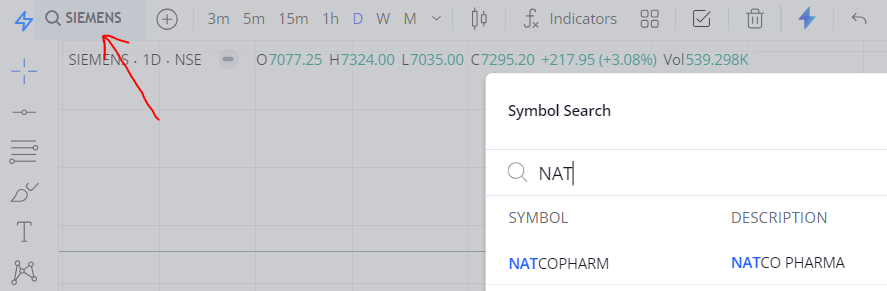
watchlist basically is changing stocks (and would be limited), better is choosing any stock with a click of a button. this is already there. click on the name of stock and type 2-3 characters of the instrument.
i hope you know pop out charts is already a feature. just take the tab to a new window.
Hi @Kaptan , discussed this with the team, and it’s on our list of things to do. Thanks for the feedback.
Since this was more than a year ago, just replying here in case this idea has gone to the back burner with the team! ![]() This feature would help loads!
This feature would help loads!
Hi @Pranay_Karwa , this has taken a bit of time, but it’s on our list. We can’t comment on the timeline yet.
Just checking back again on this thing. It’s such a basic feature to have a watchlist in the pop out chart. It would make things so much easier for traders like us who have to scroll through 100 charts in a single day scanning for the right technical setup.
Also, why doesn’t Zerodha have a relative/comparative strength indicator to check the strength of one stock over another? Such basic things for technical traders. ![]()
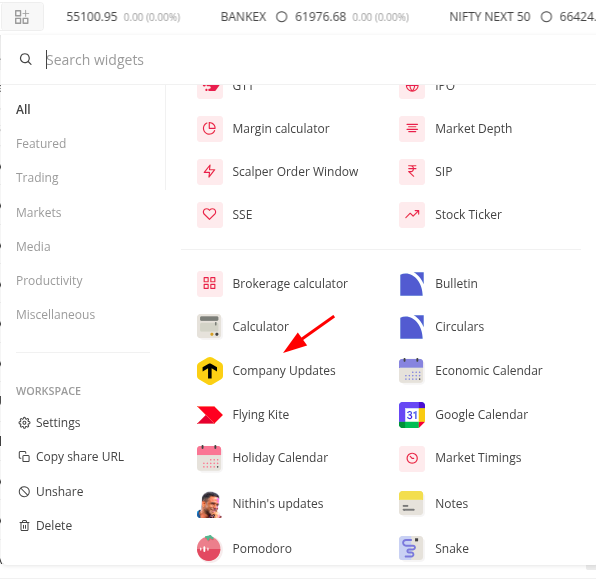
Have you checked out the new Terminal mode, which allows you to customize the required pages as widgets at your convenience?
The Ratio indicator currently available on Kite’s TradingView charts performs the same underlying calculation as a Comparative Relative Strength indicator (Price A ÷ Price B), so it can be used to compare the relative performance of two instruments. The key difference is that a dedicated CRS indicator typically overlays a signal line to make momentum shifts easier to identify.
Thanks Man! Thanks a ton. ![]()
Set up my terminal. It’s a cool thing.
Since you look to know this thing well, I was wondering if you could also tell me whether Zerodha has some feature that says about the upcoming earnings release or corporate actions of that company while i am looking at a chart. Something similar to what trading view does when you are looking at a chart and there is an upcoming earnings release, a rounded E appears at the bottom of the chart. Any widget/indicator for that?
Also checked out the ratio indicator, it has some juice to it. Can I add a simple moving average to that indicator? My strategy has an overlaying SMA 30 on CRS on help identify the shifts early.
Currently, you can view corporate actions such as dividends, stock splits, bonus issues, and rights issues on Kite charts. Read more. You can also add the Company Updates widget in your terminal mode.
Indicator overlay is currently not available on Kite’s TradingView chart. We have added this to our To-do list.