I don’t think I would be able to help you much on this with PA, because PA deals with “what is happening or anticipating with what has happened”. It can’t foretell if price will move up or down after a range, but once it has moved out then it can show trading opportunities thereof.
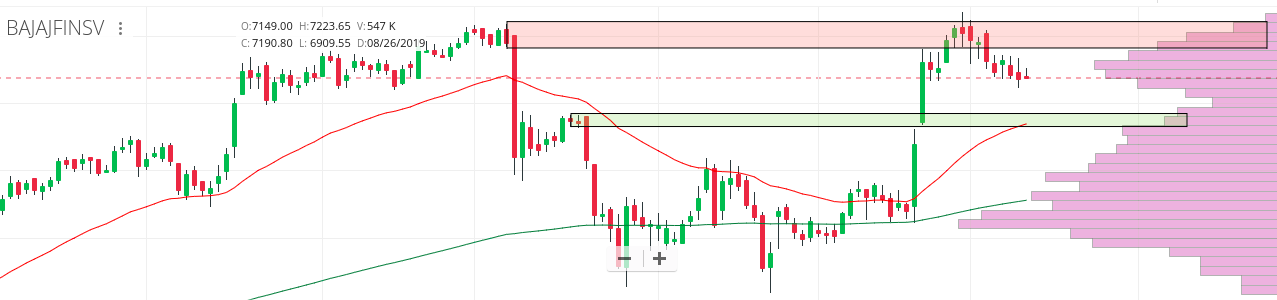
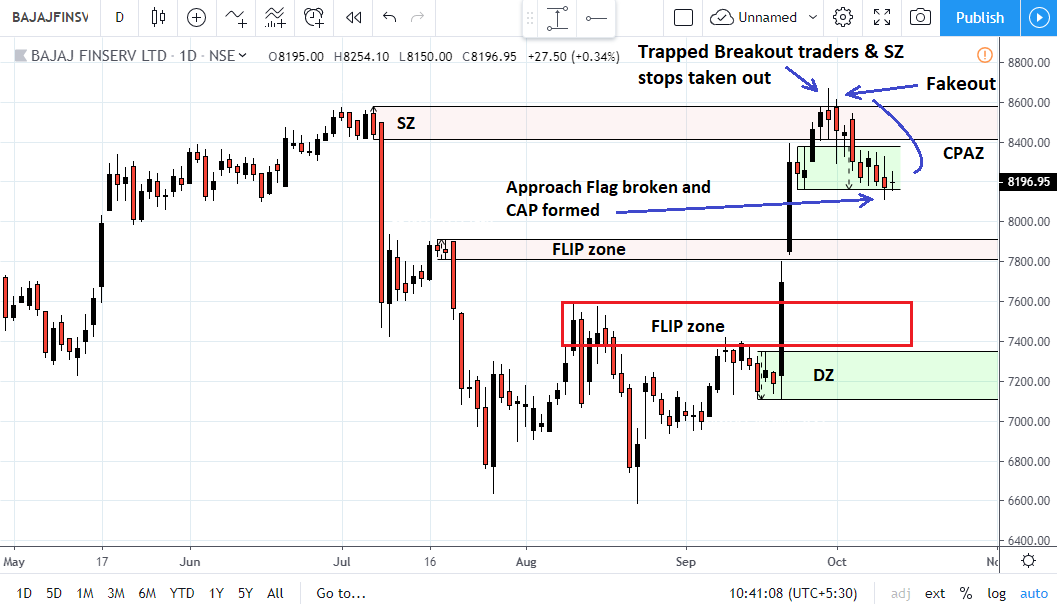
Lots of interesting PA on this daily chart of Bajajfinsrv. I have highlighted most of them. Looking for shorts on LTFs atleast till Flip zone.
1 Like
yupe thats ok explain via PA , sometimes there is breakout on upsode in range of accumulation , but it seems like stop loss hunting.
When we mark PA levels in 15m chart, there is hell lot of noise. How to do PA effectively in lower TF’s? Or should I mark PA levels on HTF’s and then use those levels as SR for LTF’s?
Alright, will post soon!
PA works on all TFs right to the 1 minute. LTFs will have their own PA going on, engulfs/breakage will also be quite common. Best approach from my view is the latter approach you mentioned. That is, to mark PA on HTFs and watch for those is the LTFs for tangible PA there.
2 Likes
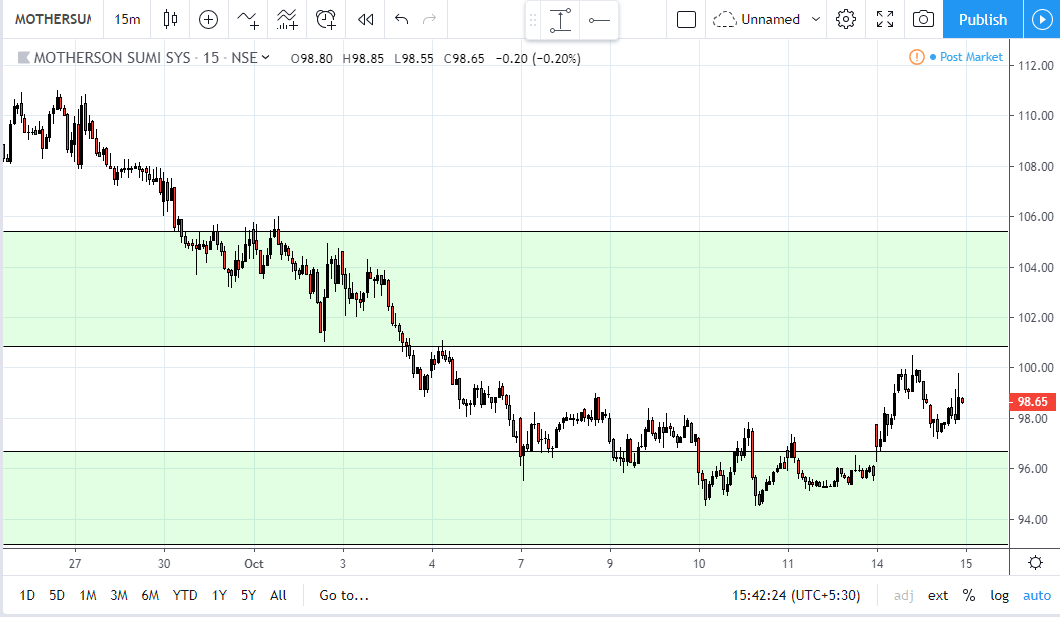
I was asking because of this, look at 15m chart of Motherson Sumi, there’s just way too much going on, no clear idea where to initiate trade and where to not. https://www.tradingview.com/x/HrKGLAau
@ShubhS9 Some PA in LTFs are difficult to understand, however, in this case of MothersonSumi, it’s not that difficult to read what Price was intending to do. Actually, this would require explaining multiple charts, but picture is clear, it would be prudent to explain the whole thing with a video, rather than keep typing and posting multiple charts! For now, please take a look at these three charts/TFs and try to come up with what price is trying to show.
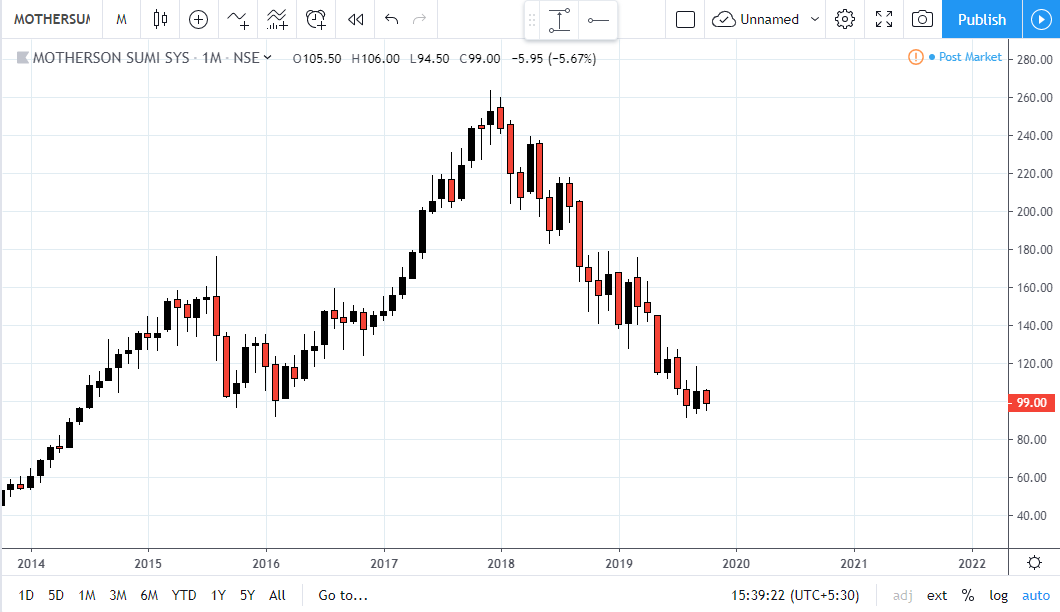
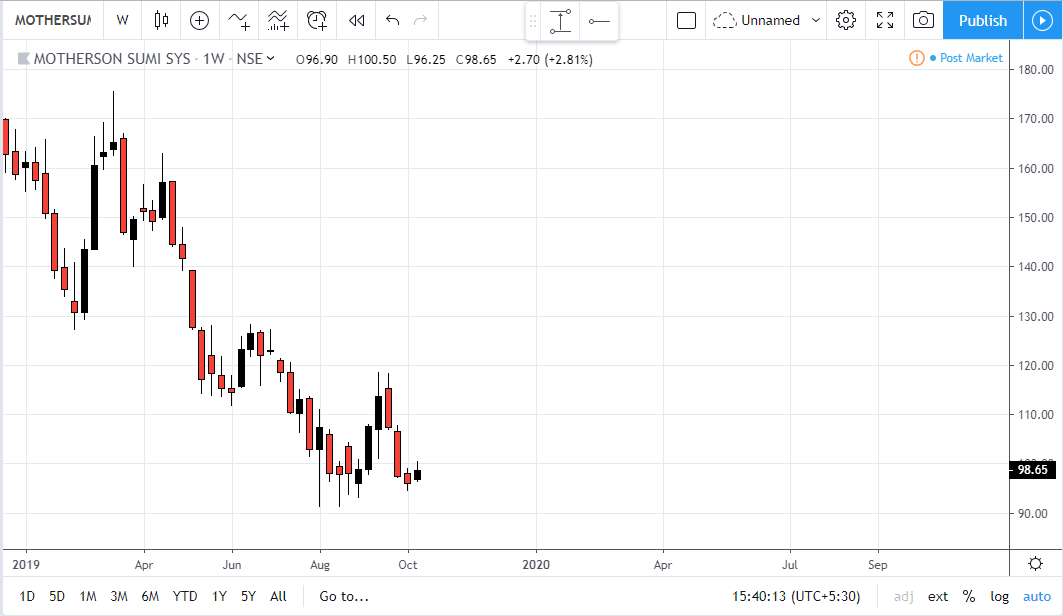

I have deliberately not marked anything except on the Daily, to avoid superimposing my thoughts on your viewpoint. Please try to come up with your thoughts on this and post them before I come up with the detailed video on this. I will wait for a couple of days.
Best!
-AlphaT
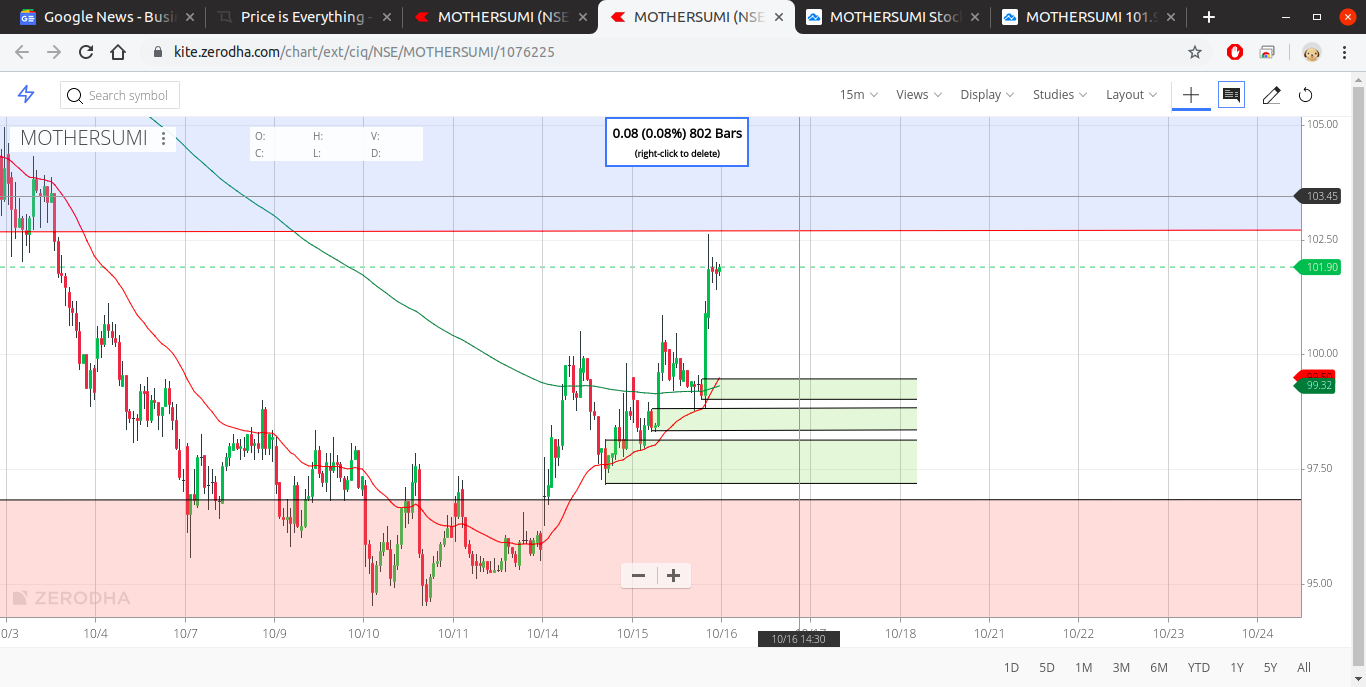
Currently making HH’s in LTF’s, confirmation comes only when we successfully pass through the SZ. If fails to breakout SZ, then one can proceed to Short with target as green zones and SL of our SZ. Pls critiqe my understanding Alpha.
1 Like
Good thinking Sai ! Just wanted to understand which SZ you are referring to? Is it the one in the 15 min TF around 103.5 ?
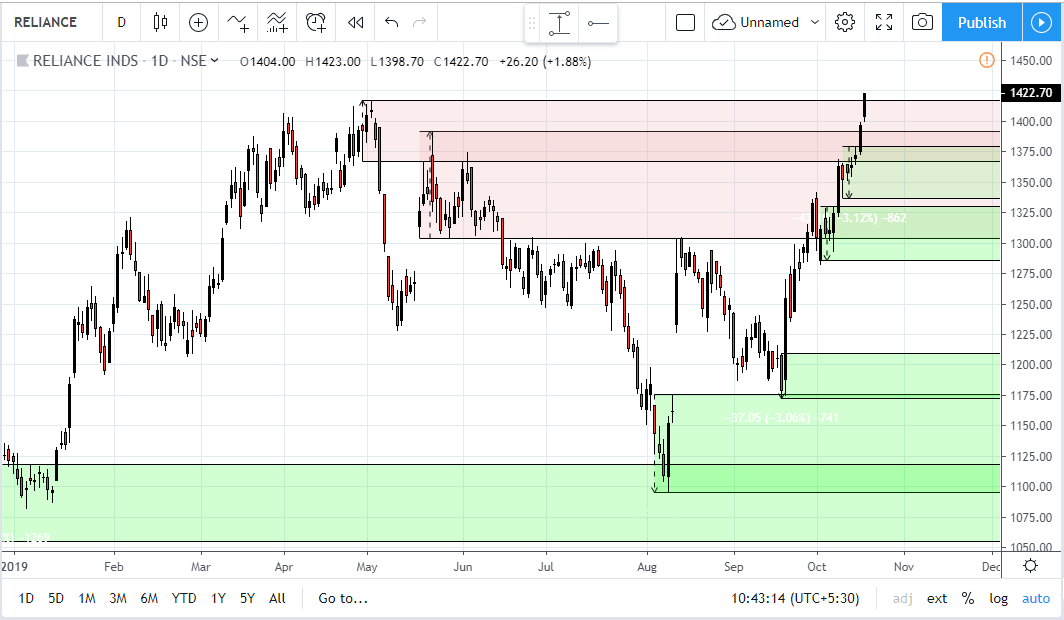
Reliance takes out HTF SZs smartly.
Would you have shorted? => Absolutely not!
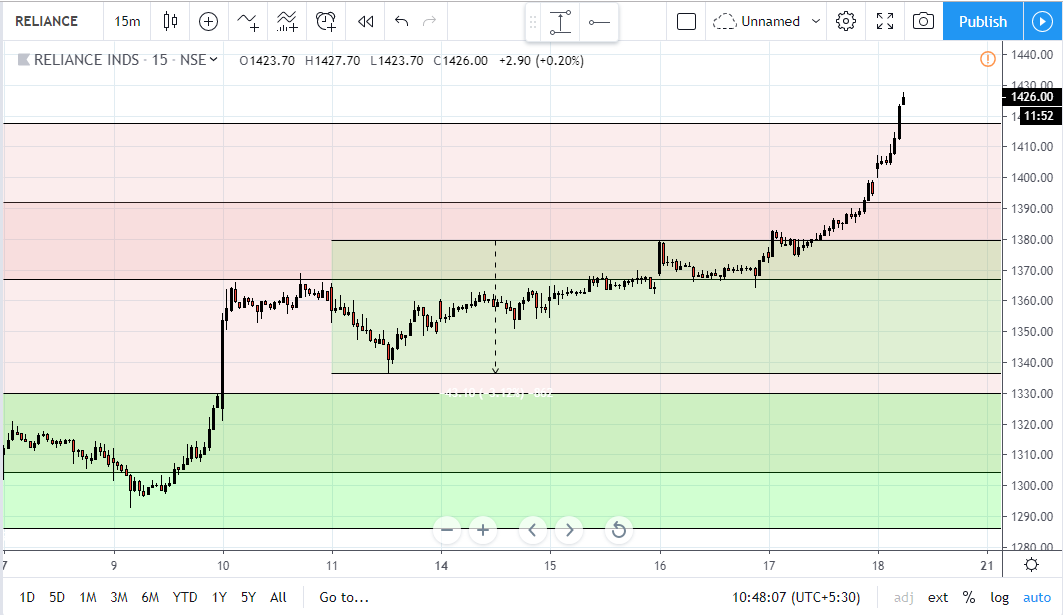
Why? => Look at LTFs.
Do you see any confirmation or reversal PA on LTFs? => No!
Daily:
15 min:
2 Likes
This looks perfect for Breakout traders.
@alphaT @ShubhS9 Wish to point out “Zig-zag” indicator, which makes rectangle mark easy for me. (Support & Resistances). Thanks
Your welcome … 