The Hindi version!
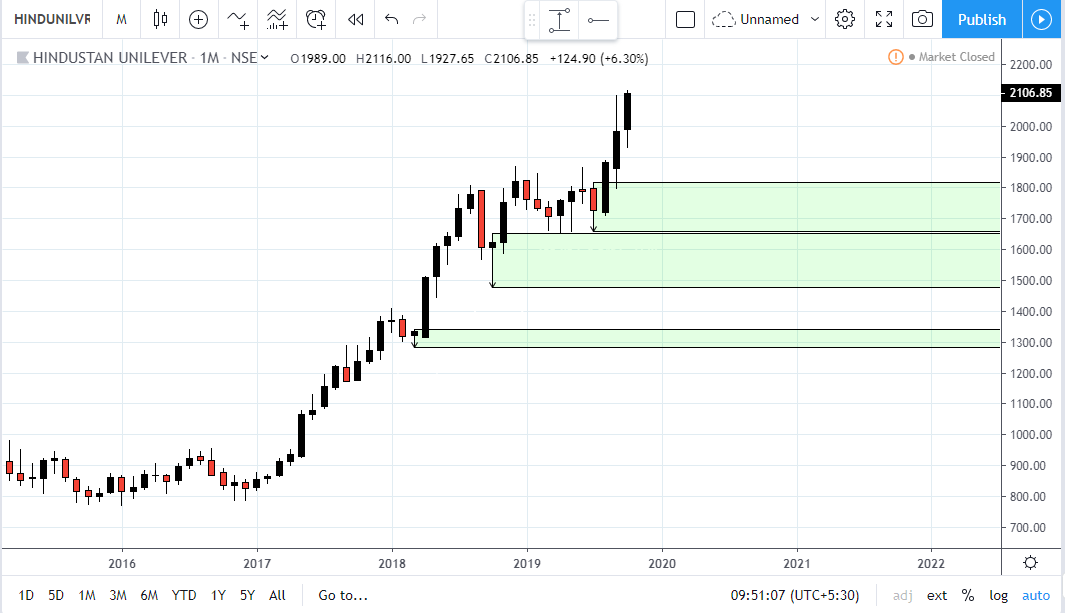
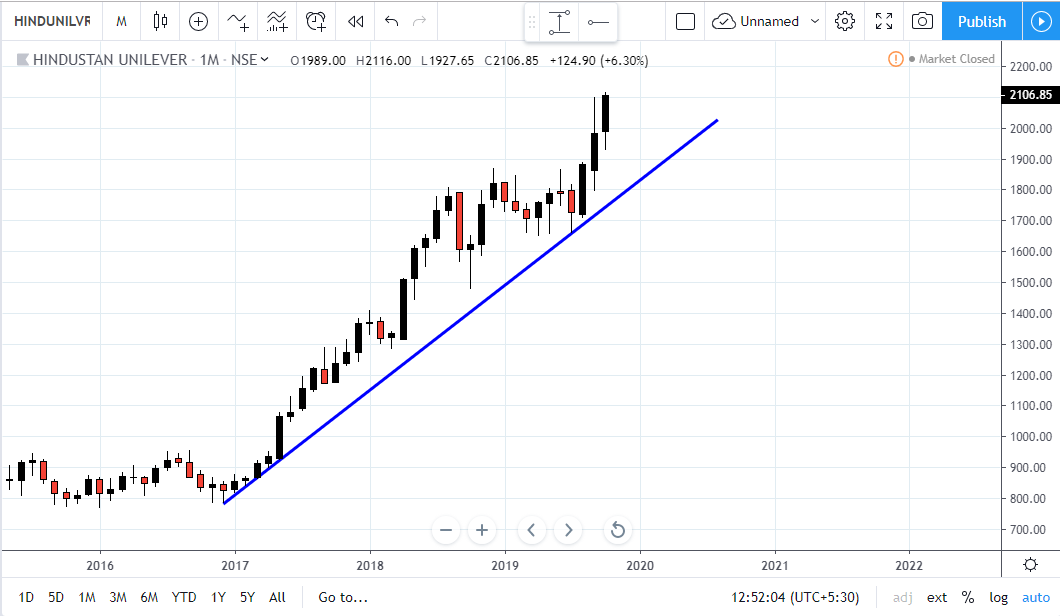
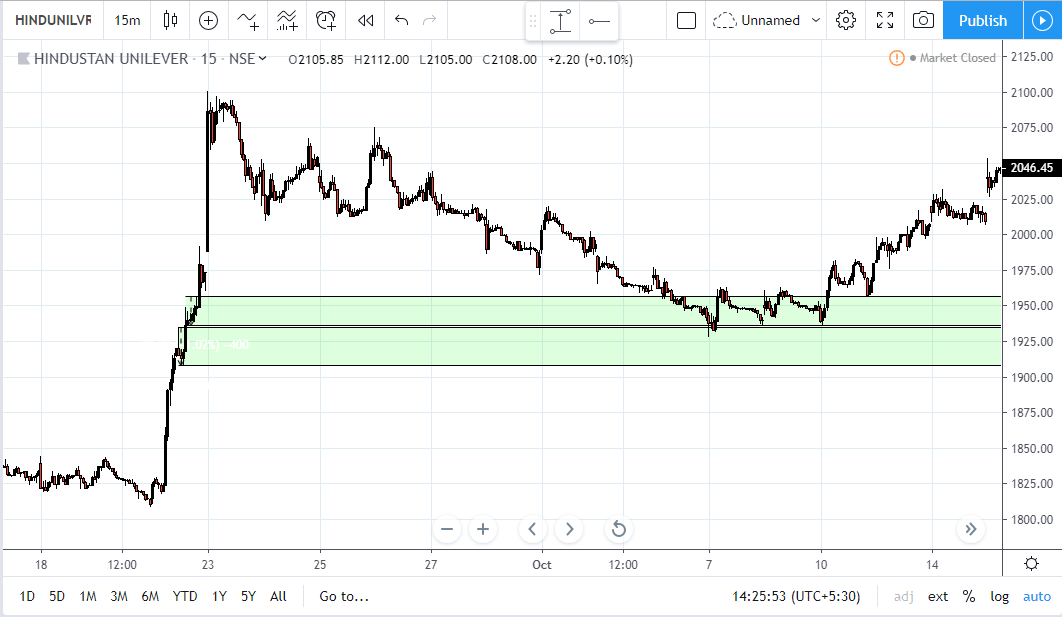
Hindustan Unilever- a stock in massive uptrend. MTF analysis for bias. What’s the bias?
M:
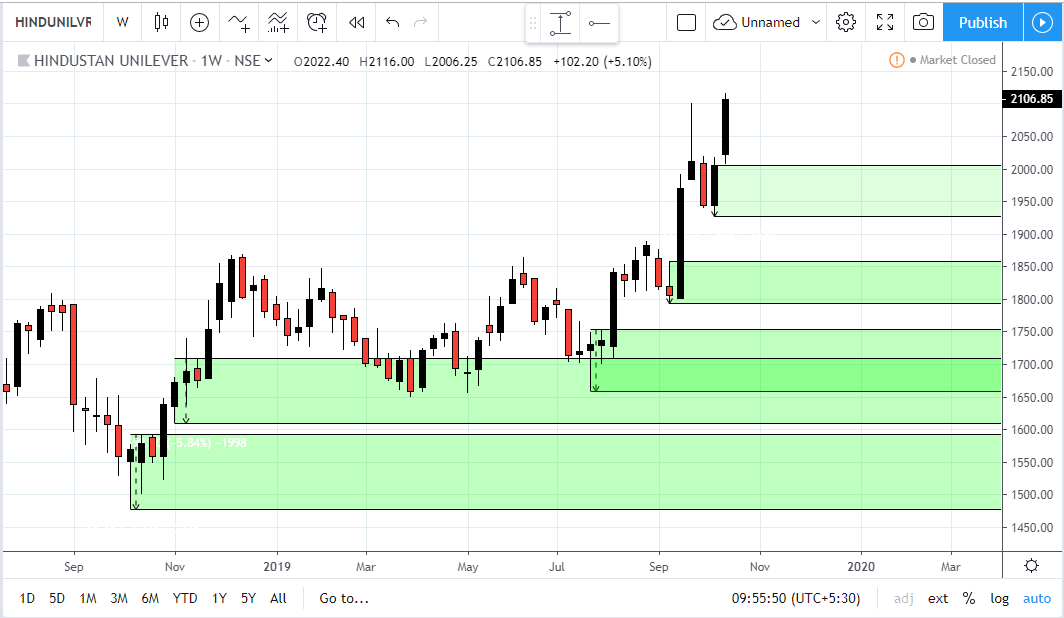
W:
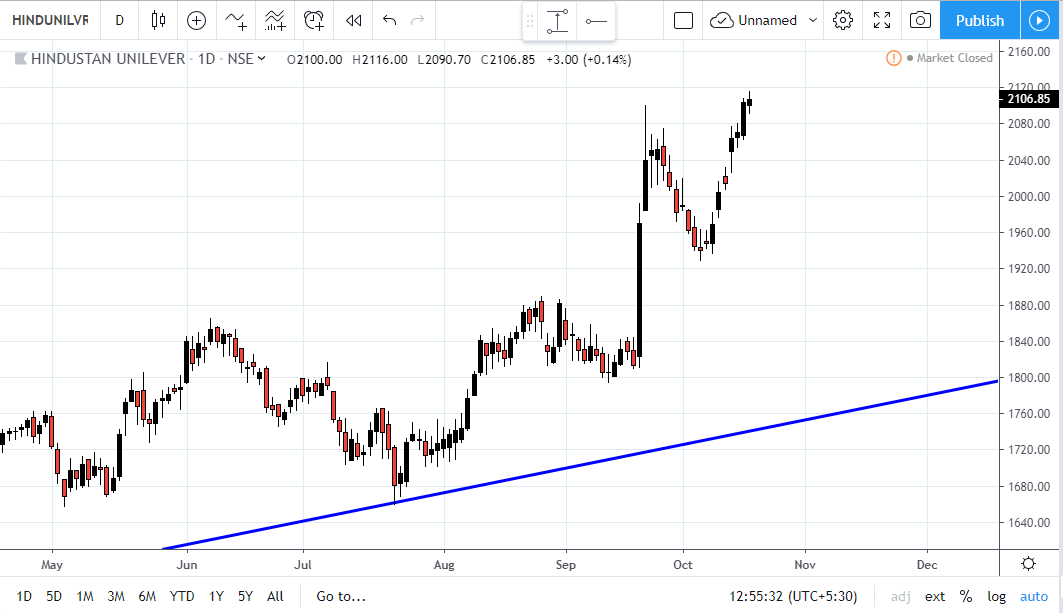
D:
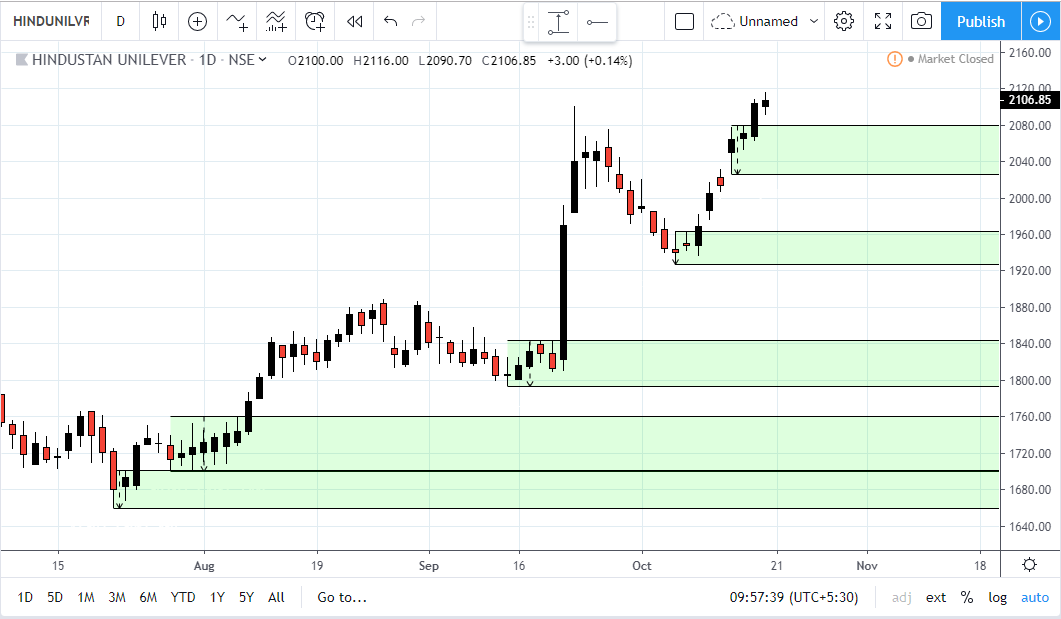
Another Question: Why did price turn upwards on 7th Oct ? Why from there ?
If u see on daily chart, there is small demand zone created at price range 1920 to 1960. Price move higher from that demand zone.
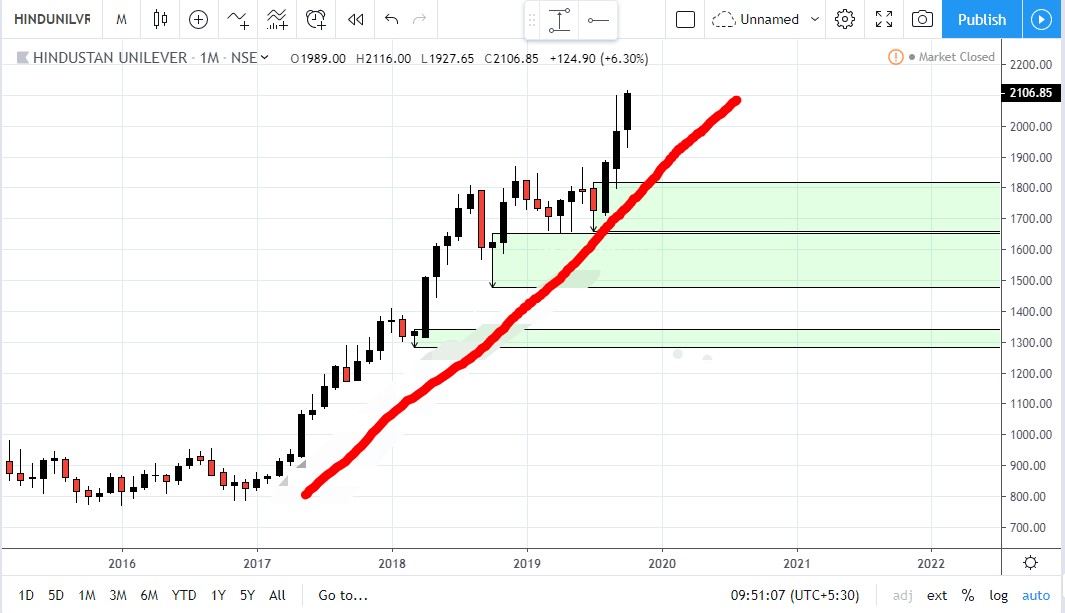
One more point, on monthly chart, if we draw the trend line then it is getting support at this demand zone (1920 -1960 price range).
So as per my technicals , it moves higher because of trend line & demand zone.
DZ got created at 1920-1960 when price turned from there, that’s correct, but question is why price turned from there? In other words, the 1920-1960 DZ was a consequence, but the question is it’s a consequence of what?
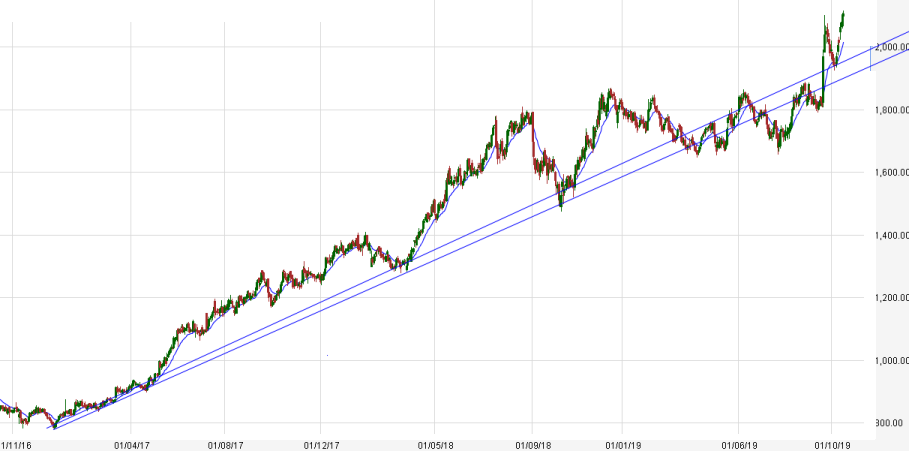
If you say it’s because of the Trendline on Monthly chart, then could you draw it and show?
How S/R traders and Breakout traders are trapped sometimes, watch it completely to get a sense of it!
4 Likes
I am bad in image edting in Mobile. Somehow I managed to draw trend line
I watched the new video & it was informative. Thanks for the details
I think reversal in prices was because change in overall market sentiment.
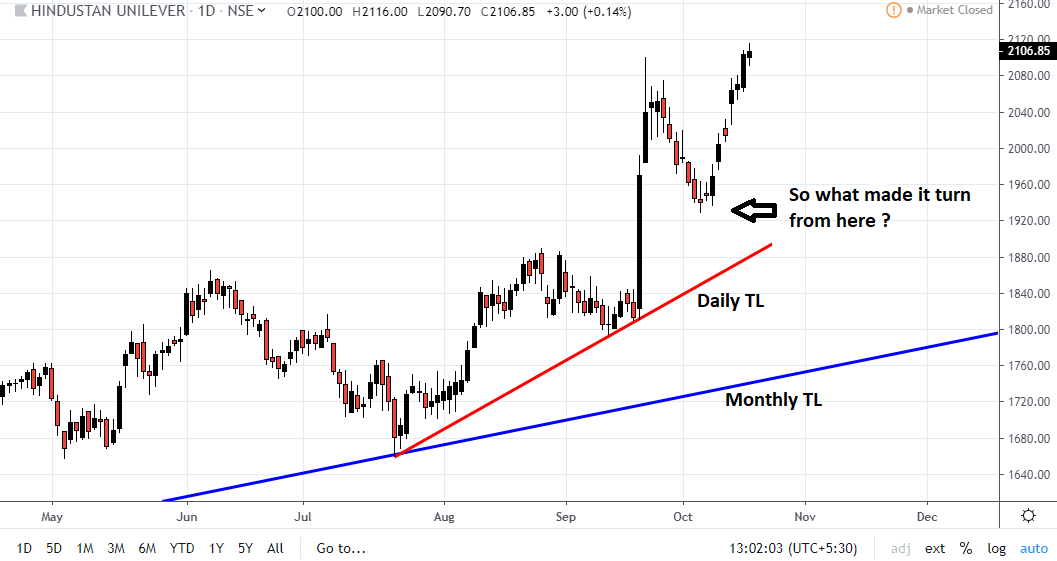
Although I am also not an expert in drawing trendlines, however, with what I know, I would draw the Monthly TL as follows:
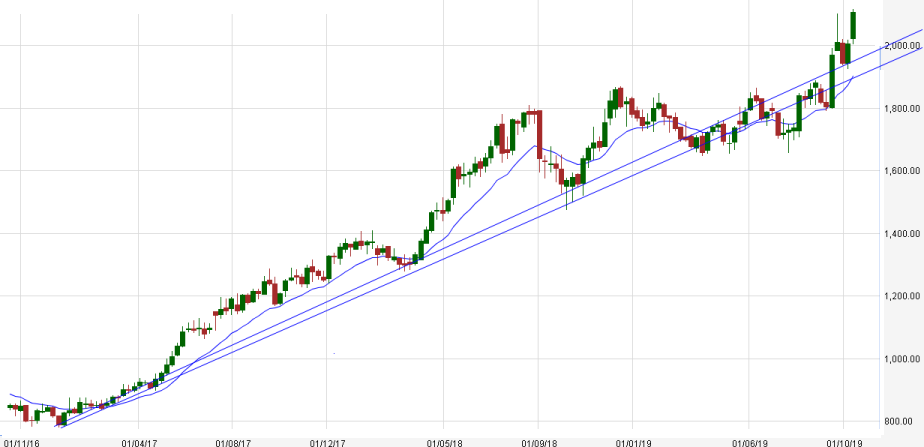
Now if I go to the Daily TF then the TL would look like this:
Now we can see that the Monthly TL was nowhere close to the price reversal near 1920-1960 that we discussed above! So why did price turn from there then?
Overall market sentiment turned bullish I agree, but is that all? Could we think from the perspective of anything that we have learned from our PA?
Maybe stock didn’t respect PA this time around, PA won’t work all the time will it?
@alphaT This is HUL chart on 15m TF… Make of it what you want. https://www.tradingview.com/x/kpU8yNBz
1 Like
Ohh… on 15 min chart , it’s clearly shown price touched the 2nd demand zone & then move higher …
2 Likes
True that! 
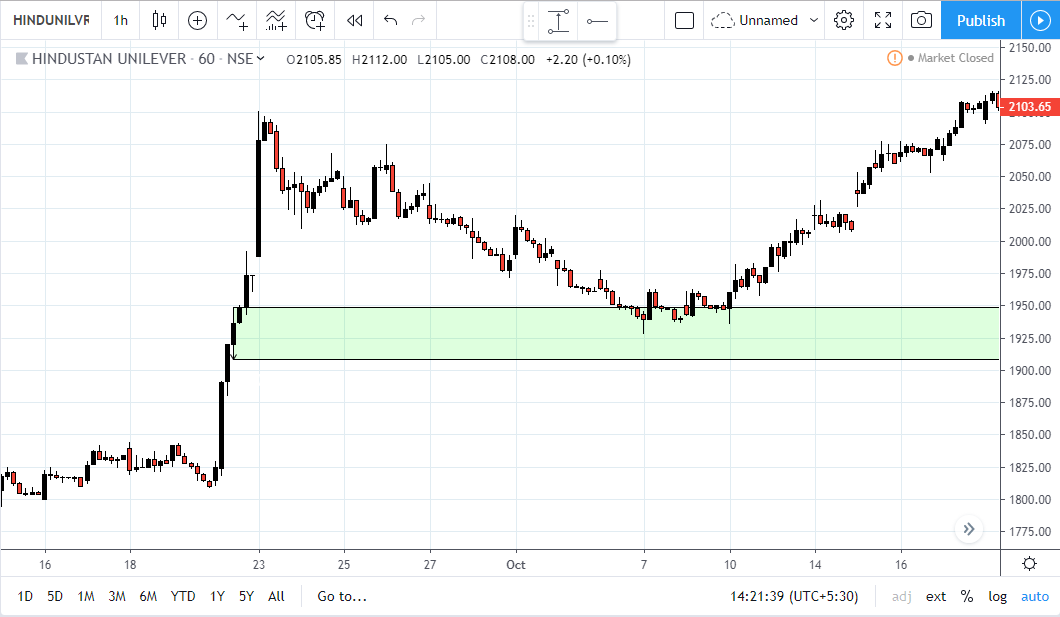
Whenever large candles are seen on higher time frame it’s better to look inside these at lower time frames  Good quiz @alphaT
1 Like
Previous broken trend line behaving as support and resistance… market peculiarities at its best!!
2 Likes
yep. TA is there to find out these peculiarities!!