If CPA while going up (HH/HL) or down (LH/LL) takes all possible triggers out for parabolic fall or rise in price then the horizontal lines we draw to get SR levels must mean nothing?
This was a Strong Supply way high up in the curve. The fall from this Supply took out all the recent lows till 02-14-2019. This supply has all the odd enhancers and also look at how price arrived into it. Big Bullish candle signifying exhaustion. And also it was a break of the Upper Bollinger bands. Due to the presence of so many factors i would just take the Short without confirmation…
Thats also a FTR demand first point where price could react
1 Like
This was a classic short in a Strong Weekly Supply… We might be heading lower to that lower Demand you marked
I am not sure if I understood the question correctly. If you could post an example with a chart, I might be able to understand it more clearly, especially the last part of the question.
1 Like
Yes I agree, the final liquidity spike was ominous, must have roped in lot of retail buyers that day! By the way, were you short? If yes, then well done Bro! 

1 Like
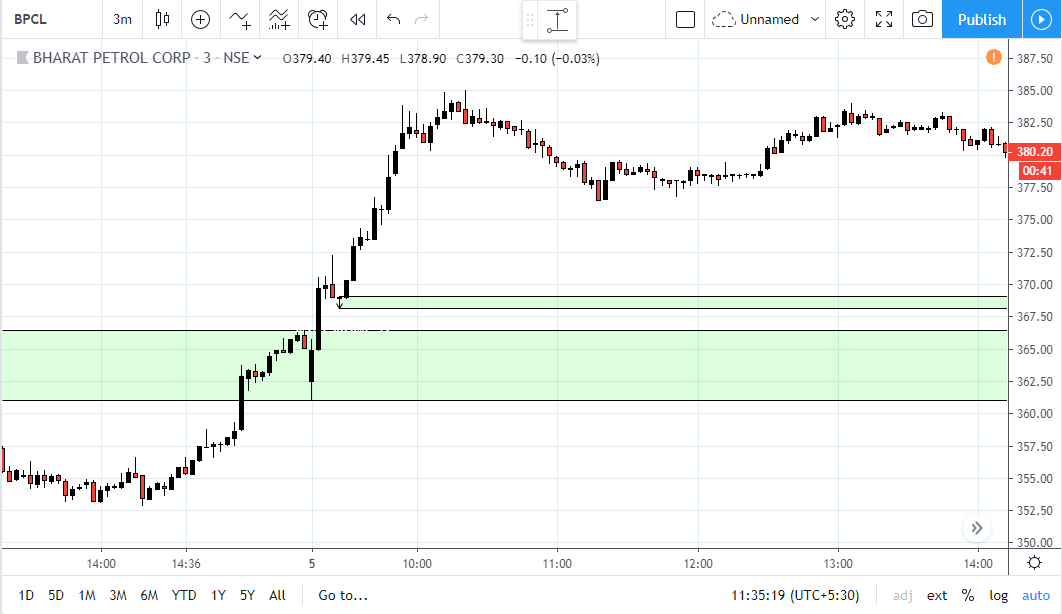
The liquidity spike was ideal… I was short in BPCl yesterday intraday.
1 Like
Yes, as of EOD today there was no PA that suggested the presence of any buy order flow there, this zone might as well break. I am always skeptical in touch trading such zones which are reactions to previous zone. That’s why prefer a conf PA.
I understand the need for confirmation as this demand is also higher in curve and we are reacting from a weekly supply. Engulf in LTF should give confirmation if the longs can be taken from this or not.
1 Like
Has anyone got RTM course to share and that too Masters
It’s a very expensive course (Euro 19,777). Don’t think anyone would be able to share it even if they have access.
Volume profile is already available on chartiq. Working on 20 market depth and trading from charts, after that will work on market profile.
2 Likes
Aah… Will trading from charts be possible on mobile as well?
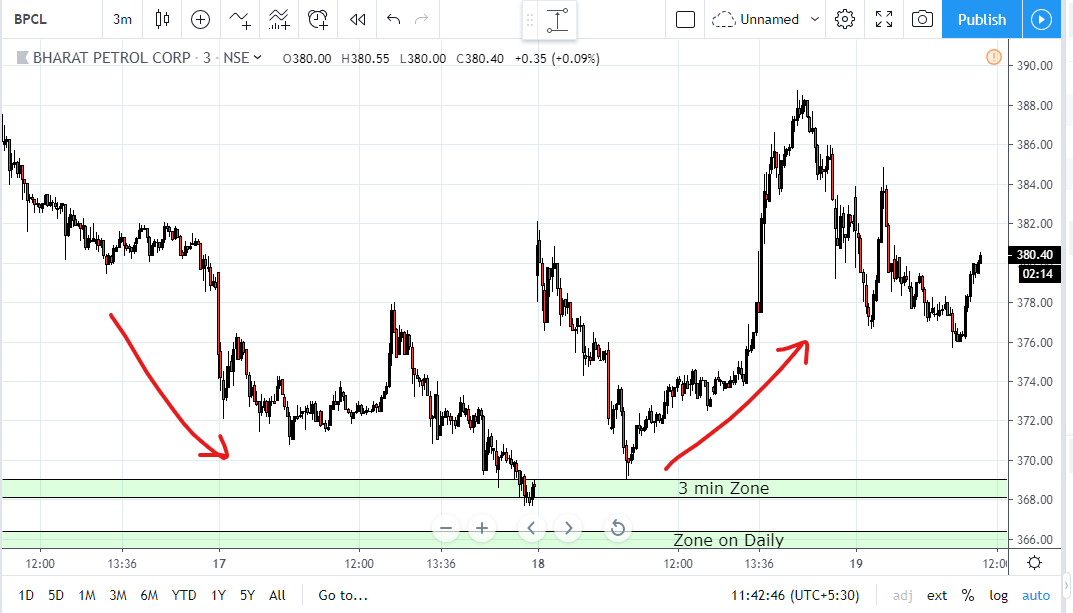
Price turned just above the the green zone. Why? Because there was a tiny 3 min zone on LTF sitting right above the daily zone. Price fake out little bit from it and shot up. This kind of PA is also very common, slightly above and below HTF zones, so need to watch out for such gimmicks by market movers.
1 Like
@dheeraj I look at multiple time frames higher and lower than the current time frame where I am executing. The HTFs gives a sense of where price is heading to and from which level, the LTFs help identify tricky zone like in the case above. Some time even the lowest time frame like the 1 min needs to be looked to locate the hotbed of pending orders, but this should be done for highly liquid scripts only. For example, if I am executing at the 15/5 min then I will take a look at the 3min and 1 min TFs.
1 Like
Got your point thanks. When you mentioned hot bed of pending orders, do you analyze tape as well
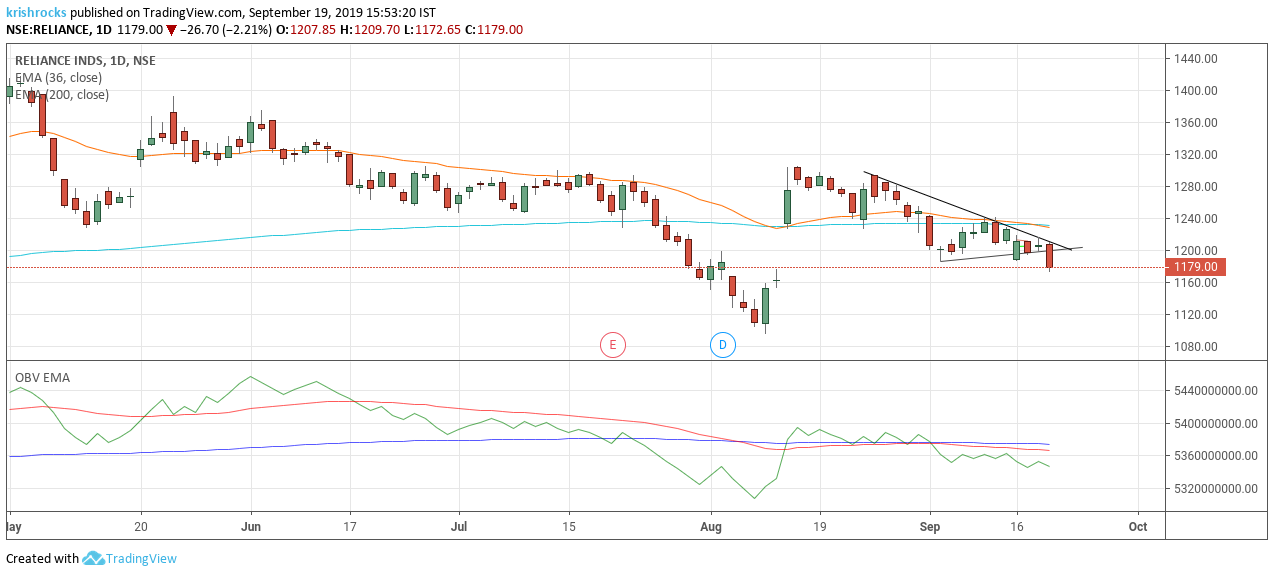
Sure Sai, I will analyse Reliance soon and share. By the by, Reliance’s chart is great to understand and witness PA across all TFs, probably because it’s heavily traded/invested by Institutions due to its index moving capability.