@siva-reddy didn’t get a reply for my issue. Is there anything being done for the drawings shifting issue?
@siva-reddy sir, i got a different issue. today in jet airways first 15 min low was good in 3-5-10 min but 15 min showing incorrect value, even after reopening many times. sending screenshot for clarification. please sort it out as it will create confusion
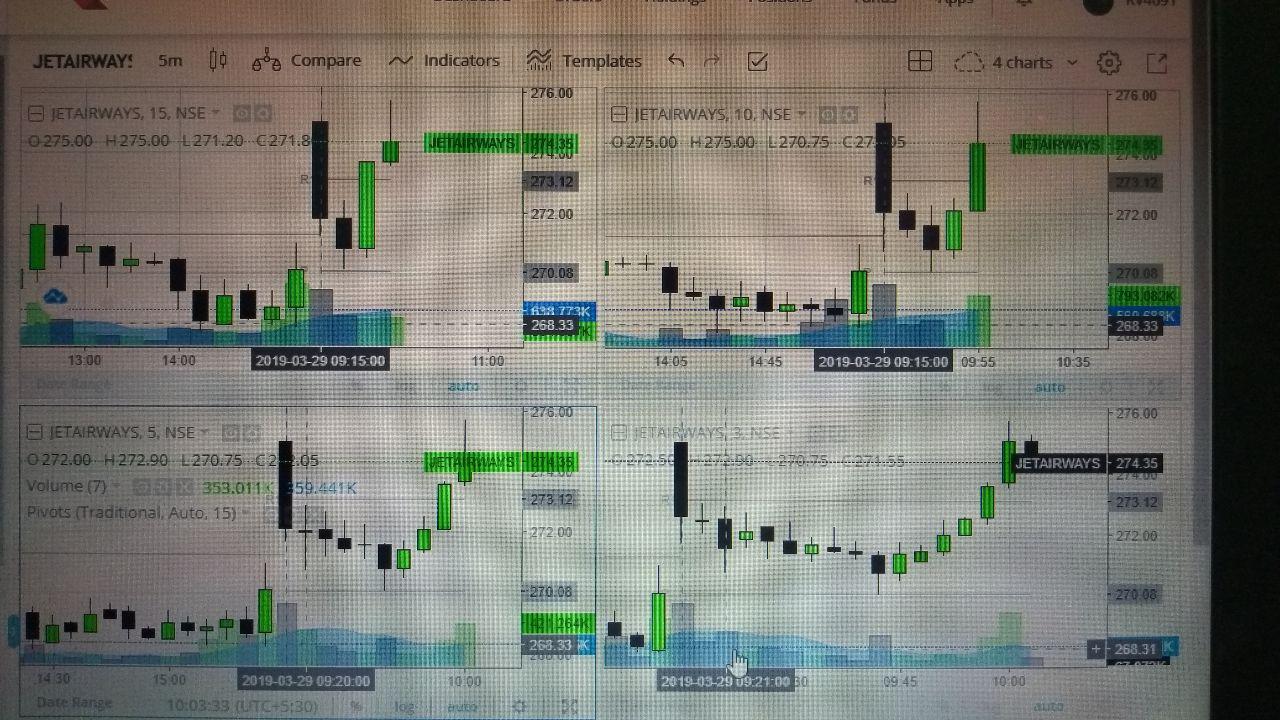
Same happened with mi on last time with infy stock
How to Refresh Trading View Chart ?
Can refresh page or change timeframe.
There seems to be a bug in the log scale button color. If I turn on log scale and set it as default template, and then refresh browser with F5, the chart is shown in log scale but log button color is grey and not blue.
Please fix this as its very confusing.
The drawings are being saved to a chart. But maximum only 10 charts are saved. If I add drawings on a new script and save only the recent one is saved and the oldest one is deleted. Does that mean only drawings can be drawn only on 10 scrips?
After changing color you can save it as layout and load it.
Yes, at a time drawings are saved only on 10 scrips, but you can create layout of 4 scrips each and save up to 40 scrips in layouts.
This is a game changer. Thanks.
@siva-reddy Hi Siva,
When will the third party indicators be enabled on TV in Kite. Some of us rely heavily on some 3rd party indicators and would for them to be included on Kite.
Also, is there a way to code them into TV on kite?
These will take some time, not easy to add though.
as the kite 3 beta version is full on playstore any way i can get link to download kite 3
New kite has same issue with wrong high/low of cadles, when i am checking on fyers platform it is showing accurate highs/low.
Why zerodha did not solved this issue and giving wrong answers to thare users
Multiple Chart Layout not working at all.
You have completely misunderstood the issue.
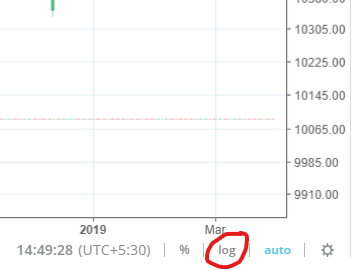
Please take a look at the image below, the log button color is grey, but log scale is actually enabled.
On mobile?
Will check.
i want to have 2 chart layout with 1 week TF on the right and 1 day TF on the left. So everytime i click for a chart in my watchlist - it should show this layout. Is it possible to make this happen as a default in K-TV?
You can create it and save it as layout, after every login once you have to load this layout and after that you can change scrips as you require, but once after every login you gave to load this layout.