I just saw a new option called ‘Continuous Data’ in Kite, can someone explain more about it.
5 Likes
Yes, we have just launched continuous futures charts on Kite for Equity.
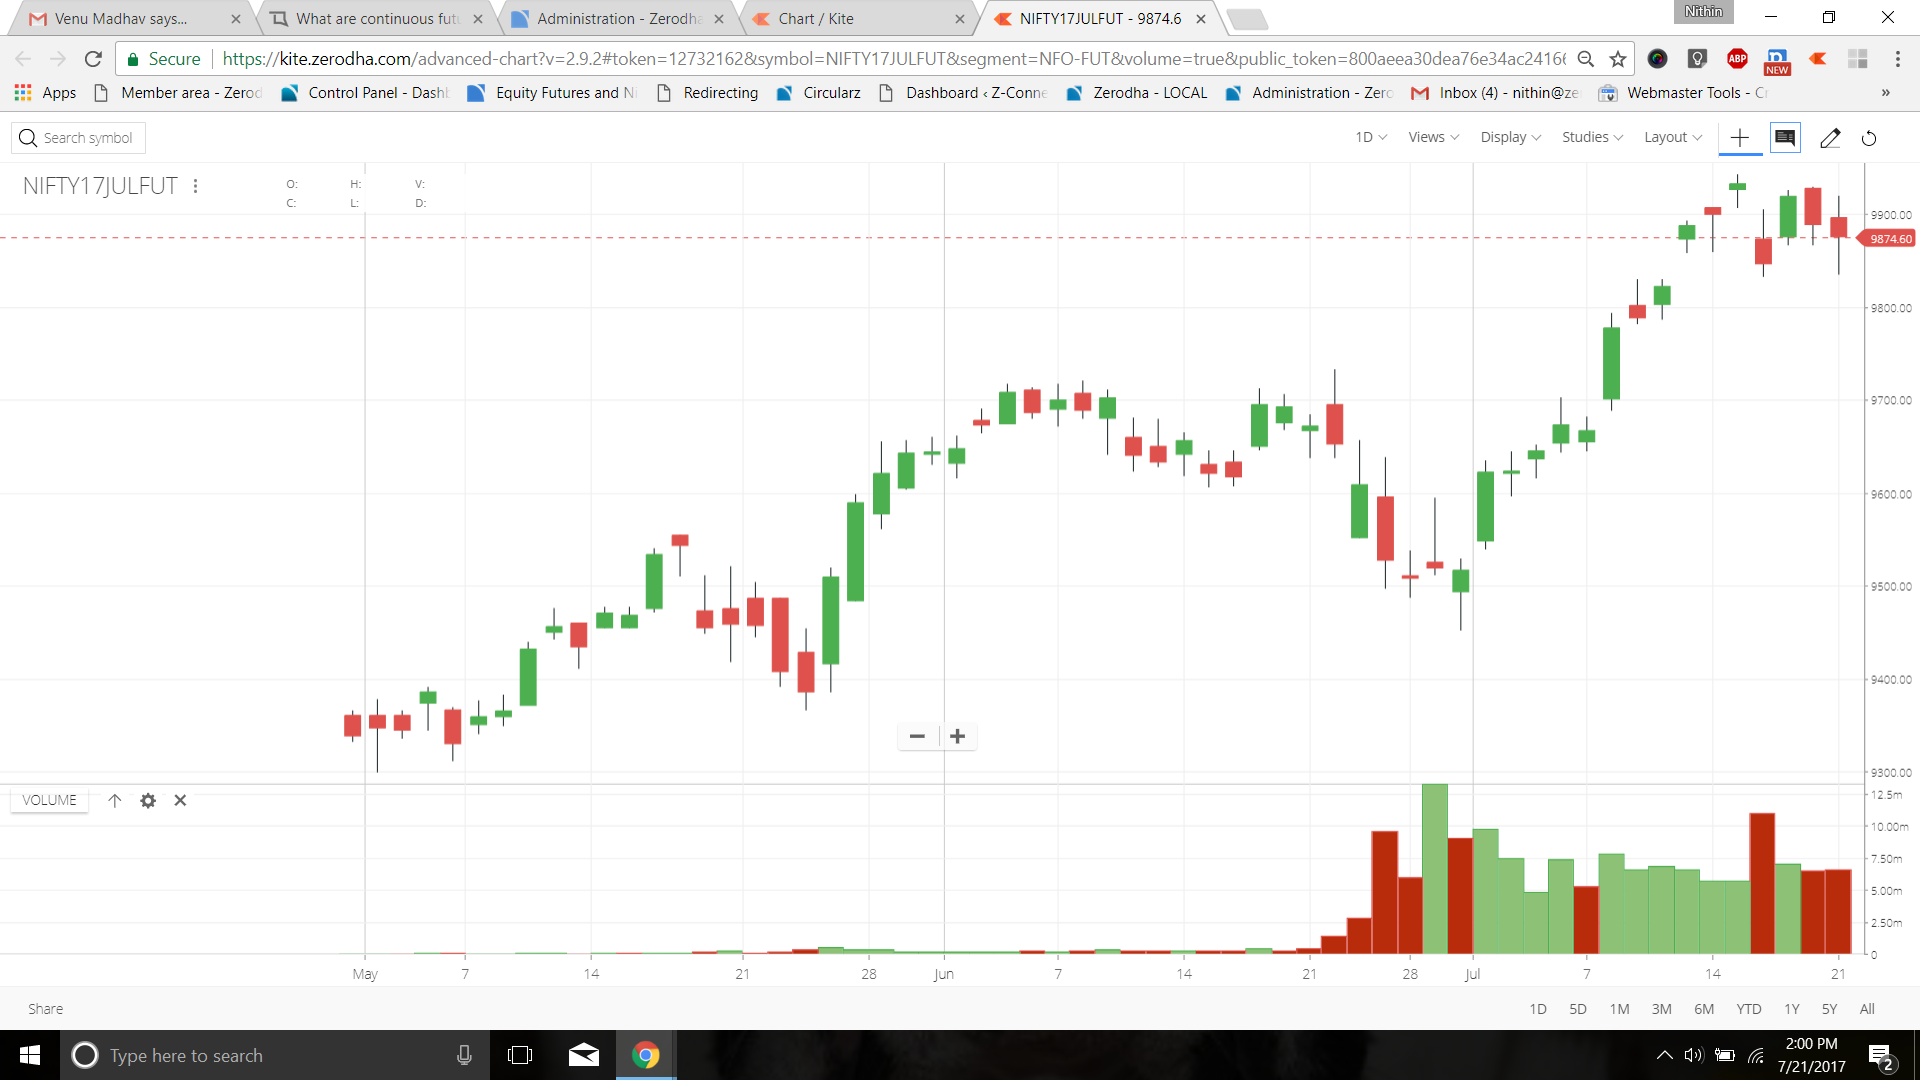
In normal futures charts - if you are looking at say Nifty17 July fut, you will have a maximum history of just 3 months (since all F&O in India have maximum contract duration of 3 months). So if you want to check how Nifty futures has behaved in the last 3 months, if you open a normal July future chart, below chart is what you will see. Chart history only from May 2017 and liquidity and volumes only from June end. If you want to see a longer term chart, you’d have to open the Nifty index (underlying) to analyse but not the futures chart.
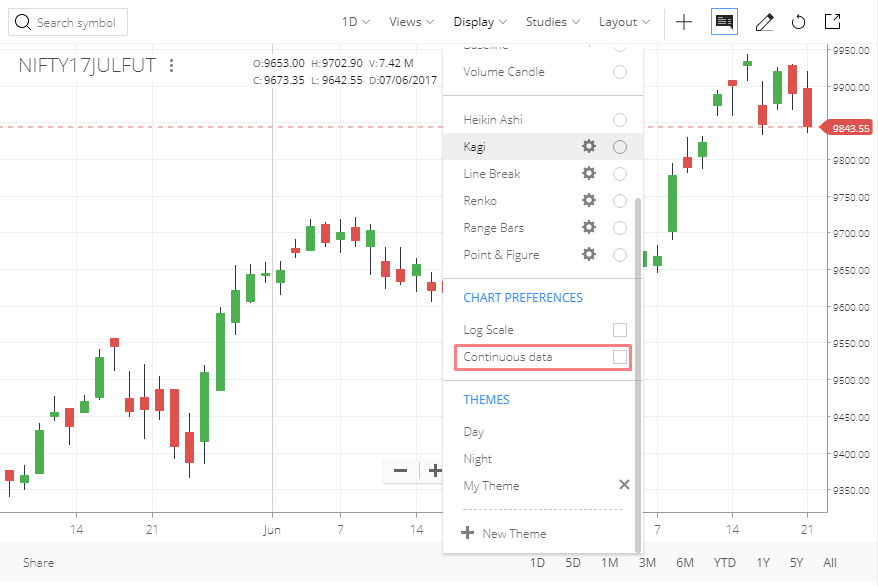
There is another option now - Continuous futures chart. ![]()
Continuous futures chart categorises all historical future contracts into current, near, and far months. So when you open a current month historical chart, it pulls data from all current month historically, plots and displays the chart. So in July - July is the current month, in June - June was the current month, In May- may was the current month, and so on. All that data is combined to show one continuous futures chart.
Now find below the same Nifty futures July chart with continuous data set. You can see candles from 2013 instead of just from May 2017. We have equity and index futures data from 2010 onwards.
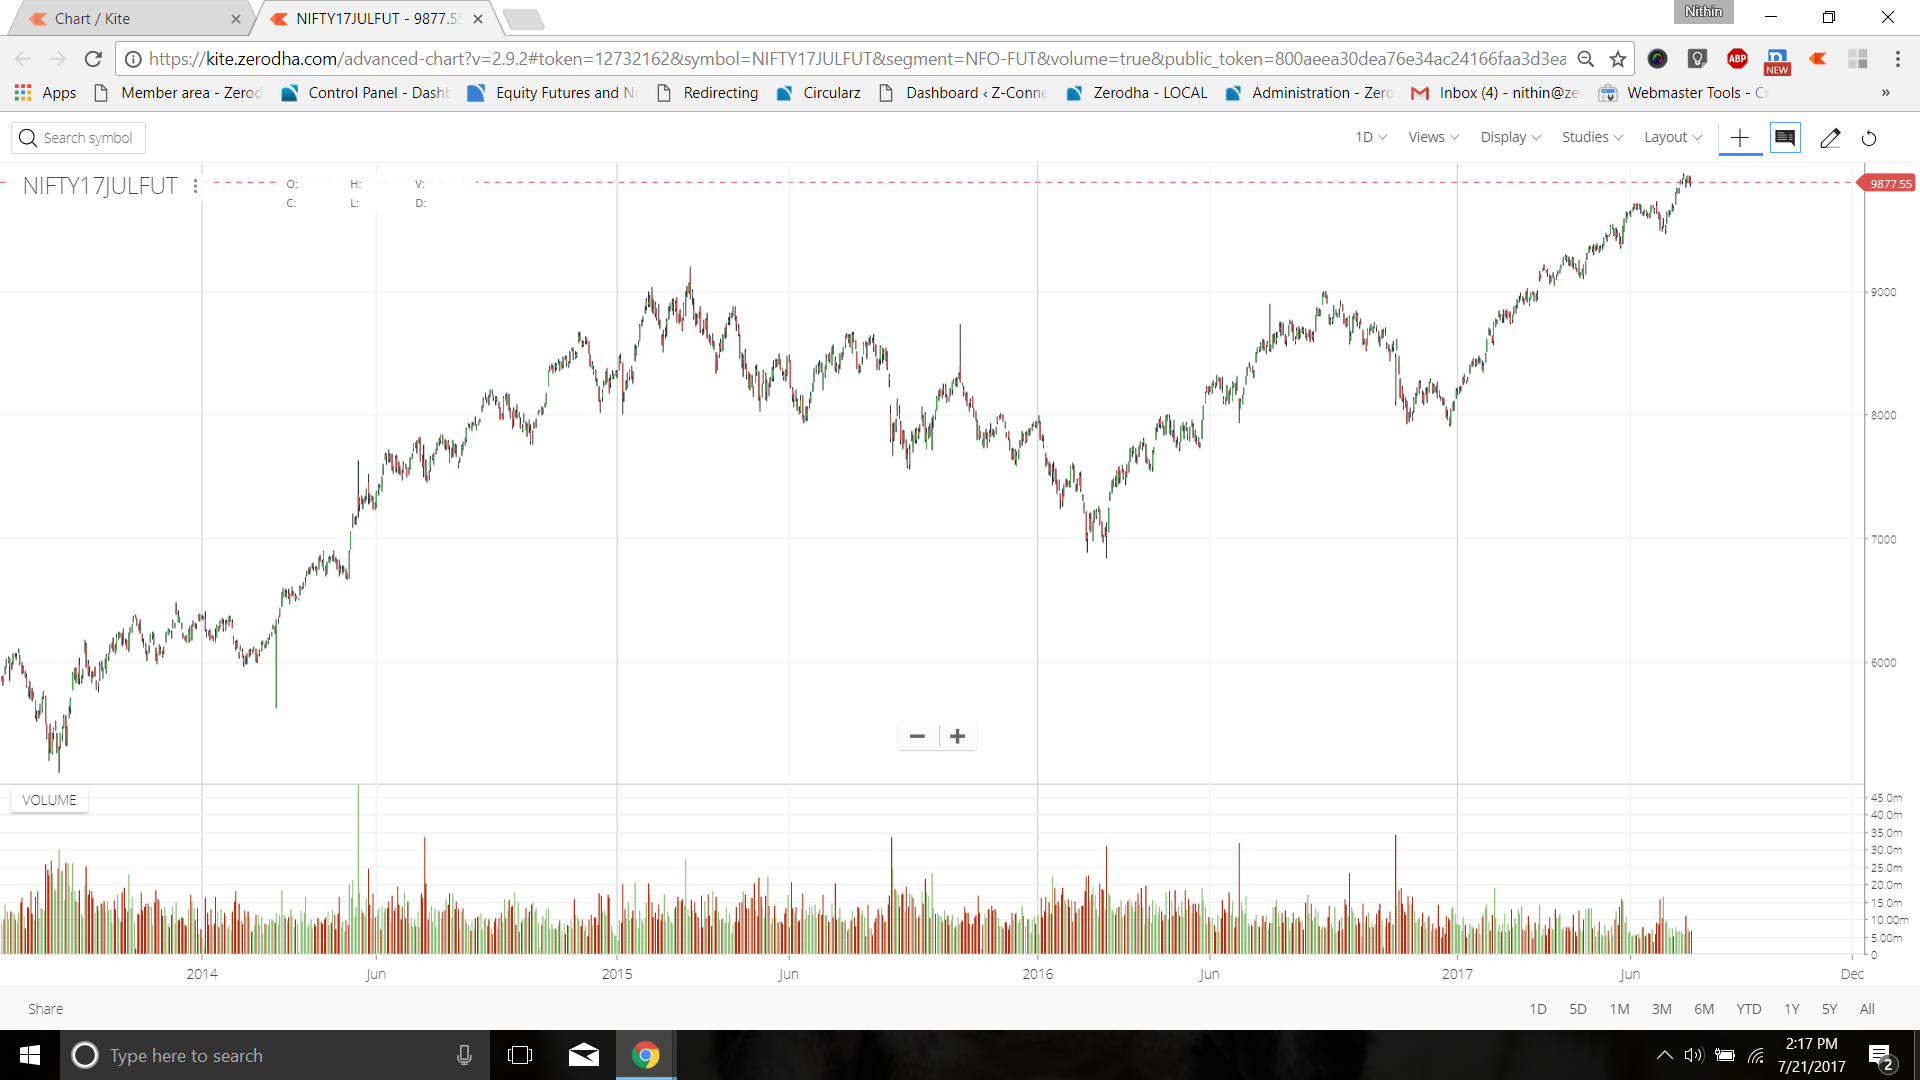
Since continuous charts are for spotting longer term trends, it is enabled only on daily candles.
We will soon have it for commodity and currency as well. This will be an important utility for commodity futures considering there is no option for an underlying chart like in equity.
27 Likes
Thank you very much!
I think that it’d be great if you could introduce continuous futures charts for commodities. Unlike in equities where you can view the underlying (for very old historical data), it’s not possible on commodities since there’re no charts for the underlying. Any plan on introducing continuous charts for commodities?
3 Likes
It would be fantastic if introduce in commodity section
4 Likes
Will the feature be added to Pi so that the data could be used for Backtesting?
If yes, tentative date?
so, how about its disappearance from watch list at expiry if I have selected continuous data ?
I believe it will continue, right ?
Since the chart is named as July Fut instead of current month, yes it will disappear from watchlist. But when you add Aug fut, that will be the current month continuous chart in Aug.
2 Likes
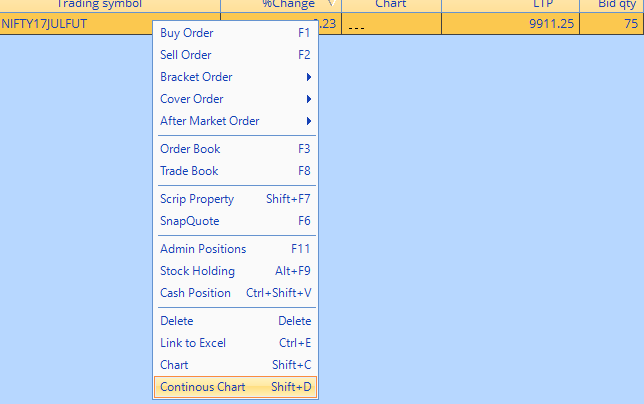
It is available on pi, add future scrip on to market watch, right click and select continuous chart option. Back-testing is not possible as of now.
Is it available for commodity section? That will be very helpful for us…
Will be coming soon.
3 Likes
It is very good feature for derivative traders… but for commodity it may not work… you cannot plot a trendline or support/resistance using historical data since that involves Forex fluctuation…
1 Like
This is absolutely amazing feature and kite is now more than just a trading platform it can now be used in a better way to analyse futures market absolutely delighted , in fact I had inquired about this feature couple of months back to the technical team hope the zerodha team gets the continuous charts for intraday also very soon . Congratulations and kudos great job .
Currently, I see that it is available at daily level. Can this be made available to lower time frames such as 5m, 15m , 30m, 1h, etc.
When will continuous charts be available for commodity futures?
This is a wonderful feature. I wanted it for so long, and was about make one for myself 
Are you adjusting the prices of previous contracts using roll factors? If not, then this continuous time series isn’t useful at all for any sort of time series analysis/technical analysis.
1 Like
@nithin when do we have continuous futures chart for commodities?. Basically I am a commodity trader and I would prefer to have continuous charts. Thank you.
Give us another week, we should have it out.
2 Likes
I agree this is a good feature.
Can you please ensure the price is adjusted for splits/bonus also, in the charts (continuous and otherwise)? Makes a lot of difference ! Thanks and appreciate it.
-
Crude oil continuous charts are available at KITE but not in PI.
-
Can we expect a continuous intraday charts for FnO & Comm. for last 1 year?
-
Please provide save chart data to excel feature in KITE also